Article Text

Abstract
Objective—To describe national trends in hospitalizations for motor vehicle related injuries among children and youth (0–24 years) of the United States Indian Health Service (IHS) from 1981–92.
Design—Descriptive epidemiologic study of the E coded national hospital discharge database of the IHS.
Results—From 1981 to 1992, the age standardized annual incidence of motor vehicle related injury hospitalizations (per 100 000 population) among American Indian and Alaskan Native (AI/AN) youth decreased more than 65% from 269 to 93. Substantial declines in hospitalization rates for all age and sex groups, all IHS areas, and most injury types were seen over this time. Injuries to vehicle occupants accounted for 78% of all motor vehicle related injury hospitalizations. The annual incidence of hospitalization (per 100 000 population) ranged from 291 in the Billings (Wyoming/Montana) and Aberdeen (the Dakotas) areas to 38 in the Portland area (Pacific Northwest).
Conclusions—National motor vehicle related injury hospitalization rates of AI/AN children and youth decreased significantly from 1981–92. This may be due to a reduction in the incidence of severe motor vehicle related trauma, changing patterns of medical practice, and changes in the use of services. Additional measures, such as passage and enforcement of tribal laws requiring the use of occupant restraints and stronger laws to prevent alcohol impaired driving, might further reduce the incidence of serious motor vehicle related injuries in this high risk population.
- North American Indians
- hospital records
- motor vehicles
Statistics from Altmetric.com
Motor vehicle related injury is the leading cause of death among persons 1–24 years of age in the United States.1 Such injuries result in the largest number of years of potential life lost and cost more than any other type of injury or disease in childhood.2
In general, the indigenous populations of the United States,3, 4 Canada,5 Australia,6 and New Zealand7, 8 have greater injury burdens than non-indigenous populations. Specifically, American Indian and Alaskan Native (AI/AN) children and youth are at especially high risk of death from motor vehicle related injuries. Motor vehicle related injury fatality rates are up to three times higher in AI/AN children than in other races.3, 4 Many of the approximately 1.5 million AI/AN individuals served by the Indian Health Service (IHS) live in rural areas of the United States. Limited public transportation, dependence on rural roads, and lack of pedestrian areas in these rural communities as well as differences in alcohol use may increase risk of motor vehicle related injury in this population.9 Patterns of deaths from motor vehicle related injury in this population have been well studied.4 However, we have found no published reports describing the national patterns of hospitalization for motor vehicle related injury in this high risk population. We therefore conducted a study of hospitalizations for motor vehicle related injuries among AI/AN youth from 1981 through 1992 to provide descriptive data and evaluate trends.
Methods
The IHS is an agency of the United States Public Health Service which provides health services to American Indians and Alaskan Natives. Subjects in this analysis included any discharge from an IHS tribal or contract hospital for a motor vehicle related injury (E810.0-825.9) involving an AI/AN individual aged 0–24 years on admission. This included in-hospital deaths. Information from 11 of the 12 IHS areas were analyzed. The 11 IHS areas studied were Aberdeen, Alaska, Albuquerque, Bemidji, Billings, Nashville, Navajo, Oklahoma, Phoenix, Portland, and Tucson (data from the California area were not available).
Hospitalizations were identified using the IHS hospital discharge data system. This includes discharges from both tribal and contract IHS hospitals for eligible individuals who reside in one of the regional service areas of the IHS. Records in the database have up to six diagnosis fields, and external cause of injury codes (E codes) have been routinely included since the early 1970s. Diagnosis and external cause of injury codes are assigned using the International Classification of Diseases, Ninth Revision, Clinical Modification (ICD9-CM) system.10
The fourth digit of an E code identifies a person's position in a crash and was used to create the categories shown in table 1. The first diagnosis code that indicated the nature of an injury was identified as the principal injury diagnosis and was used to create diagnosis categories (table 1). Head and spinal cord injury groups were based on recommendations of the United States Centers for Disease Control and Prevention.11 Other categories were based on the organization of injury diagnosis codes in ICD9-CM.10
ICD9-CM codes used to define external cause of injury and principal injury diagnosis groups
Hospital discharges for incident injuries from 1981–92 were analyzed excluding readmissions. Because no personal identifiers were available, we defined readmissions as discharges for which date of birth, sex, state, county, and community of residence codes were identical to those of a prior discharge.
Hospital discharge rates were calculated using the IHS service population, which is based on census data. This population consists of AI/AN individuals who reside in the geographic areas in which IHS has responsibilities (“on or near” reservations).12 We adjusted hospital discharge rates by the direct method using the 1940 population as the standard. For each IHS regional area, we calculated average annual discharge rates over the 12 years of the study and by four year blocks (1981–84, 1985–88, and 1989–92). Analyses were performed using the Statistical Analysis System (SAS).13
Results
There were 10 830 hospital discharges for motor vehicle related injuries among 0–24 year olds in the IHS from 1981 through 1992. Of these, 860 discharges (8%) were readmissions. Of the remaining 9970 incident cases, 9665 (97%) had a diagnosis code for an injury.
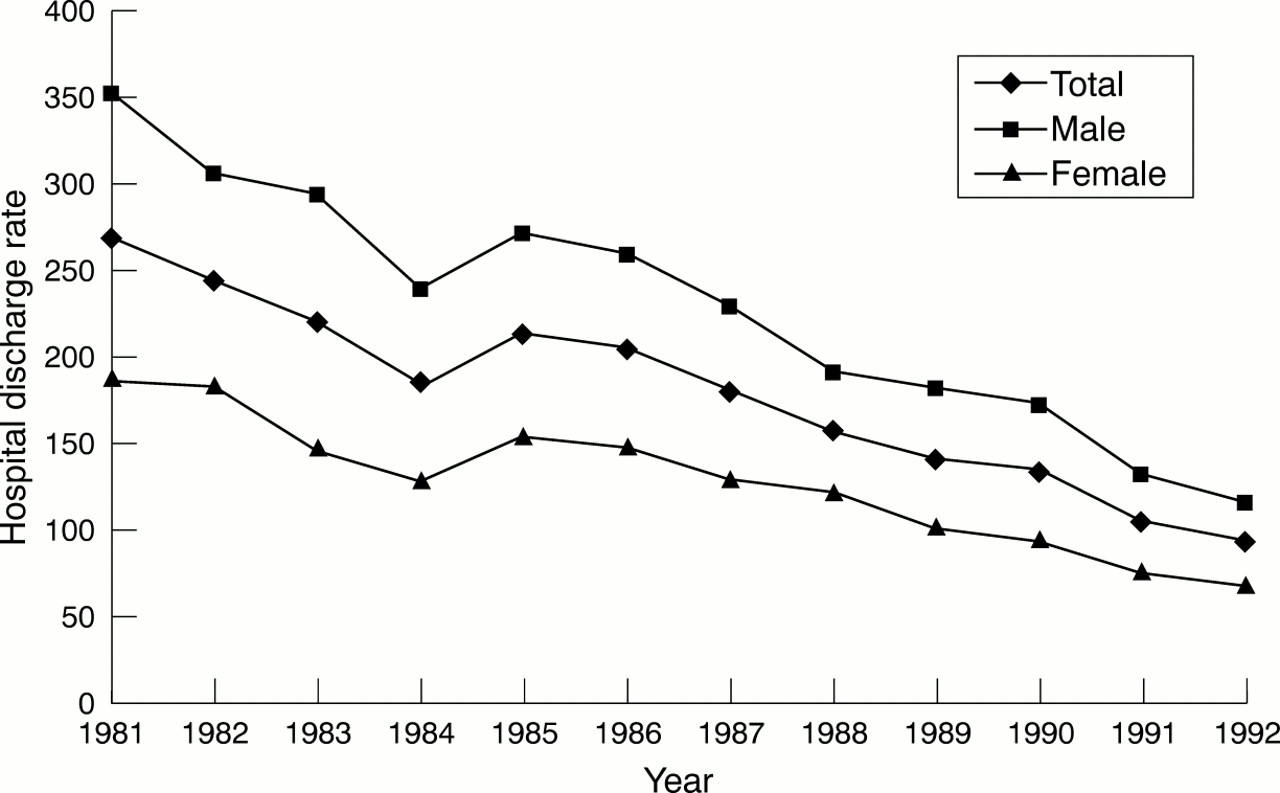
From 1981–92, the age standardized annual incidence of motor vehicle related injury discharges for AI/AN children and youth decreased more than 65% from 269 to 93 per 100 000 population (fig 1). Hospital discharge rates for motor vehicle related injuries fell by a similar percentage in all age groups (range 54–72%). However, the largest absolute decline was for the 20–24 year olds (582 to 187/100 000). Hospital discharge rates decreased by 67% and 64% for males and females, respectively, and fell for all injury types. The discharge rate for head injury decreased 41%, from 39 to 23/100 000 per year, and the rate for musculoskeletal injury decreased 54%, from 76 to 35/100 000 per year.

Age standardized motor related injury hospital discharge rates per 100 000 for AI/AN children and youth 0–24 years by sex and year, 1981–92.
Motor vehicle related injury discharge rates declined in each of the IHS areas. The largest absolute decline occurred in the Phoenix area (Arizona/Nevada) (from 316/100 000 per year in 1981–84 to 103/100 000 per year in 1989–92). The average length of hospitalization decreased from 5.7 days in 1981 to 3.9 days in 1992.
The average annual incidence of hospitalization for motor vehicle related injury (per 100 000) ranged from 291 in the Billings (Montana/Wyoming) and Aberdeen (the Dakotas) to 38 in the Portland area (Pacific Northwest). Eighty two per cent of the hospitalizations were for injuries sustained on public roads (E810-819.9) while the remainder occurred in an off-road (non-traffic) area (E820-825.9). A comparison of the age specific motor vehicle related injury hospitalization rates between the IHS and the US population in 1985 is shown in table 2. Average annual hospital discharge rates by age and injury type are presented in table 3; rates by age and principal injury diagnosis are presented in table 4.
Age specific national hospital discharge rates (per 100 000) for motor vehicle related injury for the IHS and US 14 populations, 1985
Average annual hospital discharge rates (per 100 000 population) for motor vehicle related injuries among AI/AN children and youth aged 0–24 years by age and type of injury, 1981–92
Average annual hospital discharge rates (per 100 000 population) for motor vehicle related injuries among AI/AN children and youth aged 0–24 years by age and principal injury diagnosis, 1981–92
From 1981–92, age standardized hospital discharge rates for injuries to motor vehicle occupants decreased 64%, from 215 to 77 per 100 000/year. Rates for injuries to motor vehicle occupants were greater than for all other E code groups combined, and occupants accounted for 78% of all motor vehicle related injuries in this analysis. Males 20–24 years of age had the highest average annual rate of hospital discharge for occupant injury (365/100 000), while 5–9 year old females had the lowest rate (30/100 000). Over 17% of the 20–24 year old males who were injured as occupants were also diagnosed with acute alcohol intoxication (diagnosis codes 303.0 and 305.0). Musculoskeletal injury accounted for 32% and head injury for 20% of the principal injuries to occupants. Although spinal cord injuries constituted only 1.1% of all discharges for occupants, 91% of all spinal cord injuries in this analysis occurred to occupants.
The age standardized hospital discharge rates for pedestrian injuries decreased 64% (from 25 to 9 per 100 000/year) between 1981–92, and approximately 11% of all motor vehicle related discharges involved pedestrians. The highest average annual rates for pedestrian injuries were observed in 0–4 and 20–24 year olds, while the lowest rates were seen in 10–14 year olds. Musculoskeletal (45%) and head injuries (15%) were the most common diagnoses for pedestrians. Rates of hospitalization for the pedestrian injuries that occurred in off-road areas (E822.7) were also greatest for those 0–4 years of age. This age group alone accounted for over 56% of all such hospitalizations among 0–24 year olds.
Ten per cent of all motor vehicle related injury discharges involved motorcycles, and the rates of discharge for motorcyclist injuries increased with age. Those aged 15–24 years had the highest average annual hospitalization rates, and males had nearly six times the rate of females in this age group. Head injury was the principal diagnosis for 16% of these injuries.
Only 2% of all motor vehicle related injury hospitalizations were for injuries to bicyclists. The rate peaked in the 5–9 year age group, although 10–14 year old males had the highest age and sex specific rate (5.3/100 000/year). Twenty four per cent of injured bicyclists were admitted for head injuries.
Discussion
Hospital discharges for all types of motor vehicle related injury among AI/AN youth decreased substantially in the 1980s. Most of these hospitalizations were for motor vehicle occupants. Males, and individuals over 15 years, had the highest rate of motor vehicle related hospitalization.
We did not find significantly higher rates of hospitalization among AI/AN than the United States as a whole (table 2). This is likely because the rates we report underestimate the true rate of motor vehicle related injury hospitalization among AI/AN youth. In fact, in the state of Washington, just 24% of hospitalizations of AI/AN individuals enter into the IHS hospital discharge data system (David Grossman, personal communication, 1998). If this is true in other areas, AI/AN youth would have significantly higher rates of motor vehicle related injury hospitalization than the US population similar to the pattern seen for motor vehicle related fatalities.
We observed the highest rates of motor vehicle related hospitalization in the Billings and Aberdeen areas. Several reasons may account for this. These areas have some of the highest alcoholism mortality rates in the IHS.12 Additionally, these two areas are more rural than many of the other IHS areas, and rural areas generally have higher motor vehicle related mortality rates than urban areas.9
The decline we observed could have been due, in part, to several factors other than a reduction in the incidence of severe motor vehicle related injuries. These factors include changes in medical practice emphasizing outpatient management, differences in access to or use of IHS medical services, and changes in E coding practices. However, our results are consistent with the recent decline in deaths from motor vehicle related injury in the IHS population.4 The death rate (per 100 000) from motor vehicle related injuries decreased 46% for AI/AN youth 0–24 years old, from 53.1 in 1981 to 28.7 in 1992 (National Center for Injury Prevention and Control, CDC, unpublished data). This decline comes during a time of increased attention to traffic safety by tribal leaders. For instance, in July 1988, the Navajo Nation enacted a primary enforcement seat belt law, and the prevalence of seat belt use increased from 14% to 60% from June 1988 through September 1991.3 Our data show that the law was associated with a 30% decline in the annual incidence of hospitalization for occupant injury in the Navajo area (from 178/100 000 in 1985–88 to 125/100 000 in 1989–92).
LIMITATIONS
Several other issues regarding these data could have affected our results. First, a brief period of under-reporting of specific E codes at contract (non-IHS) hospitals occurred after a change in an IHS billing procedure in 1987. This under-reporting was recognized by IHS and addressed, but this could have caused a small decline in the discharge rates for a brief period. Still, 80% of the discharges in this analysis were from IHS hospitals and therefore were not affected by this problem.
Second, the quality of these and any E coded hospital discharge data is limited by the completeness of the reporting of injury information in the medical record.15 In fact, 20% of the records analyzed for this report were coded E819.9, which represents a “motor vehicle related traffic accident of unspecified nature” involving an injury to an “unspecified person”. We counted these “unspecified persons” as occupants, which may have overestimated the occupant rates and underestimated the non-occupant rates.
Also, our definition of readmission may have resulted in an underestimation of the hospitalization rates. By counting only the first admission for records that matched on five demographic variables, we would not count new injuries of the same individual over the 12 years studied, or injuries of different individuals who matched on those variables.
In a broader sense, this analysis represents the potential utility of national E coded hospital discharge data in the study of pediatric injuries. Such data can provide valuable information for the surveillance of severe injuries and can be used to evaluate injury trends, establish injury control priorities, and design injury prevention programs. Currently 20 states require E coding (CDC, unpublished data) and 27 states have hospital discharge data systems.16 The uniform billing form that is used in all American hospitals (UB-92) contains a labeled space for an E code16 which facilitates the collection of this information. In addition, the development of standard E code groupings will make it easier to compare E coded hospital discharge data from different states.17
Implications for prevention
Although motor vehicle related injuries in this population have declined in the past decade, there is room for further prevention efforts. A 1995 tribal traffic safety law assessment conducted by the IHS and the National Highway Traffic Safety Administration found that of 174 tribes reporting, 63 still did not have a seat belt law and 56 did not have a child passenger restraint law.18 The passage and enforcement of primary seat belt laws, laws requiring car seats for young children, motorcycle helmet laws, and laws banning the transportation of individuals in the back of pick-up trucks, would further reduce the toll of motor vehicle related injury in this population. Low cost child restraint loaner programs may help promote use among low income families. In addition, stricter tribal laws against alcohol impaired driving should be considered, because nearly one in five of the 20–24 year old males hospitalized for injuries sustained as occupants in this analysis were intoxicated. This likely underestimates the problem due to lack of testing for and reporting of alcohol use in the victims of trauma. Comprehensive impaired driving programs that include strict drinking and driving laws, combined with community programs such as sobriety checkpoints could be instituted. Physician counseling to AI/AN parents about effective motor vehicle related injury prevention practices for themselves and their children also should be encouraged.3, 19