Article Text

Abstract
Objectives: This study described epidemiologic patterns of recreational injuries among school aged children in the US and assessed the relation of these patterns to socioeconomic status.
Methods: Combined data from the 1997–98 National Health Interview Surveys for 38 458 children aged 6–17 years regarding non-fatal recreational injury episodes that received medical attention, reported by a household adult, were analysed. Logistic regression analysis was used to assess the association between recreational injury and socioeconomic status while controlling for confounding factors.
Results: The annualized rate of recreational injury was 91.2 episodes per 1000 children, with an increased risk associated with a higher family income status or being non-Hispanic white. For children from not poor families, most injury episodes occurred in sport facilities, whereas for children from poor and near poor families, most occurred outside the home.
Conclusion: Recreational injury is a significant health problem for school aged children in the US. Non-Hispanic white children and children from affluent families are at increased risk of recreational injury.
- recreational injury
- socioeconomic status
- school aged children
- CI, confidence interval
- ICD-9-CM, International Classification of Diseases, 9th revision
- NCHS, National Center for Health Statistics
- NHIS, National Health Interview Survey
- OR, odds ratio
- recreational injury
- socioeconomic status
- school aged children
- CI, confidence interval
- ICD-9-CM, International Classification of Diseases, 9th revision
- NCHS, National Center for Health Statistics
- NHIS, National Health Interview Survey
- OR, odds ratio
Statistics from Altmetric.com
- recreational injury
- socioeconomic status
- school aged children
- CI, confidence interval
- ICD-9-CM, International Classification of Diseases, 9th revision
- NCHS, National Center for Health Statistics
- NHIS, National Health Interview Survey
- OR, odds ratio
- recreational injury
- socioeconomic status
- school aged children
- CI, confidence interval
- ICD-9-CM, International Classification of Diseases, 9th revision
- NCHS, National Center for Health Statistics
- NHIS, National Health Interview Survey
- OR, odds ratio
Participation in sport and other recreational activities can provide school aged children with health benefits but may also result in injuries that prevent future involvement. A recent report from the National Center for Health Statistics (NCHS) estimated that 12 million injuries occurring to people of all ages in 1997 were related to leisure time and sport activities, accounting for 35.8% of all reported injury episodes.1 Few data, however, were available to describe epidemiologic patterns of recreational injuries for school aged children.
The association between socioeconomic status and the occurrence of various diseases or conditions has been recognized.2,3 Most previous studies reveal an increased risk of injury mortality in relation to lower socioeconomic status.4–6 Whether this inverse socioeconomic gradient pertains to injury morbidity, however, remains controversial.7–12 Intuitively, the role of socioeconomic status may vary for injuries that occur at work, at home, or at recreational events, depending on exposure to injury provoking activities. Thus, an analysis based on the aggregation of all injuries may obscure the true association between socioeconomic status and any specific type of injury event.
This study aimed to identify epidemiologic patterns of recreational injuries among school aged children and to assess the association between them and socioeconomic status in the same population.
METHODS
Source of data
We analyzed combined data from the 1997–98 National Health Interview Survey (NHIS). The NHIS is a face-to-face interview conducted annually by the NCHS using a representative sample of the non-institutionalized population residing in the United States. In 1997, the content and format of the NHIS was extensively redesigned. The complex sample design of the NHIS was described elsewhere.13 The redesigned NHIS has a set of core questions that remain largely unchanged from year to year.
Injury data collection
Information is collected from an adult family member about injuries occurring in the past three months to any family member residing in the home at the time of the interview. The redesigned injury questions focus on non-fatal medically attended injury episodes instead of acute conditions resulting from the episode, as was the case before 1997.14 An injury episode refers to a traumatic event in which a person was injured one or more times from an external cause. A medically attended injury episode is one for which a health care professional was contacted, either in person or by telephone for advice or treatment. Changes in the injury section have been described in more detail elsewhere.1
The redesigned NHIS includes verbatim text information on how the injury happened, the body part(s) injured, and the type of injury. This information, along with responses to questions about specific type of injury episode, place of occurrence, and activity when the injury occurred, was used by coders to assign International Classification of Diseases, 9th revision (ICD-9-CM ) diagnostic and external cause codes (E codes) for all episodes. Up to four ICD-9-CM diagnosis codes and three E codes were assigned for each injury episode. During the data editing process, episodes were limited to those including at least one health condition classified as an injury.1
If an NHIS respondent reported any medically attended injuries, he or she was asked what the person was doing when the injury happened. The list of options given included driving, working at a paid job, working around the house or yard, attending school, unpaid work, sports (organized team or individual such as running, biking, and skating), leisure activity (excluding sports), sleeping (or resting, eating, drinking), cooking, being cared for, and other. The respondent was able to choose more than one of these categories. In this study, recreational injuries were defined as those that were reported as occurring while children were engaged in leisure time or sport activities. Other information obtained included whether the injury episode caused any limitation, loss of school days, or hospitalization.
Measures of socioeconomic status
To increase the ability of detecting socioeconomic differences in health outcomes, it has been suggested that at least two individual measures of socioeconomic status be used.15,16 In this study, socioeconomic status was defined by two indicators: family income level and highest educational attainment among all adults in the family. The family income level was derived from a relative index calculated by NHIS data processing staff as a ratio of family income to the published Census Bureau 1996 and 1997 poverty thresholds for a specific family size and composition. Based on this ratio, a family income status variable was created with categories of poor (ratio <1.00), near poor (1 ≤ratio<2.00), not poor (ratio ≥2.00), and unknown. When a child was living with the mother or father only, the educational attainment was not ascertained for the absent parent. Instead, the highest educational attainment among all adults in the family was used to measure the parent(s), in most cases, or guardian(s) educational background.
Other sociodemographic variables
Other variables considered in the analysis included the child's age, sex, race and ethnicity, region of residence, urban/rural residence, living arrangements, and health insurance status. A child was not considered insured if he or she had only a private plan that paid for one type of service such as vision or dental care.
Statistical analysis
To obtain annual estimates, we calculated recreational injury episode rates by taking the number of episodes per 1000 children per three months and multiplying this by 4. The estimates were weighted to provide national population estimates and to adjust for non-response.13 All analyses were conducted using the SUDAAN software to incorporate the complex sample design of the NHIS.17 Significance tests were conducted at the 0.05 level.
Rates and percentages with relative standard errors (standard error of the estimate) greater than 30% were considered unreliable and thus were not shown but identified with asterisks in the tables that follow. Direct standardization was used to estimate age-sex adjusted rates using the year 2000 projected population as standard population. The age groups used for standardization were 6–10, 11–13, and 14–17 years, reflecting elementary, middle, and high school ages, respectively. Differences between percentages or rates were evaluated by χ2 test. Logistic regression analysis was used to assess the relation between recreational injuries and socioeconomic status while controlling for confounding factors. The dependent variable was an indicator identifying if a child was ever injured in the past three months and the independent variables were family income status and highest educational attainment of adults in the family. The effect of race/ethnicity on recreational injuries was evaluated by adding this variable to the model. Previous studies have indicated that it is acceptable to include several socioeconomic status measures in the same model.15,16,18
RESULTS
In 1997 and 1998, the NHIS interviewed 79 396 families with a total of 38 458 children aged 6–17 years. Response rates for all ages were 90.3% in 1997 and 88.2% in 1998. A total of 1167 non-fatal medically attended injury episodes were reported during the three month recall period among sampled children; 777 of these occurred to children while engaged in recreational activities.
Recreational injury episode rates
The annual weighted number of recreational injury episodes occurring among children was 4.3 million, accounting for 18.7% of all recreational injury episodes occurring to people of all ages. The annualized recreational injury episode rate was 91.2 per 1000 children. During the three month recall period, 3.6% of injured children had more than one such episode.
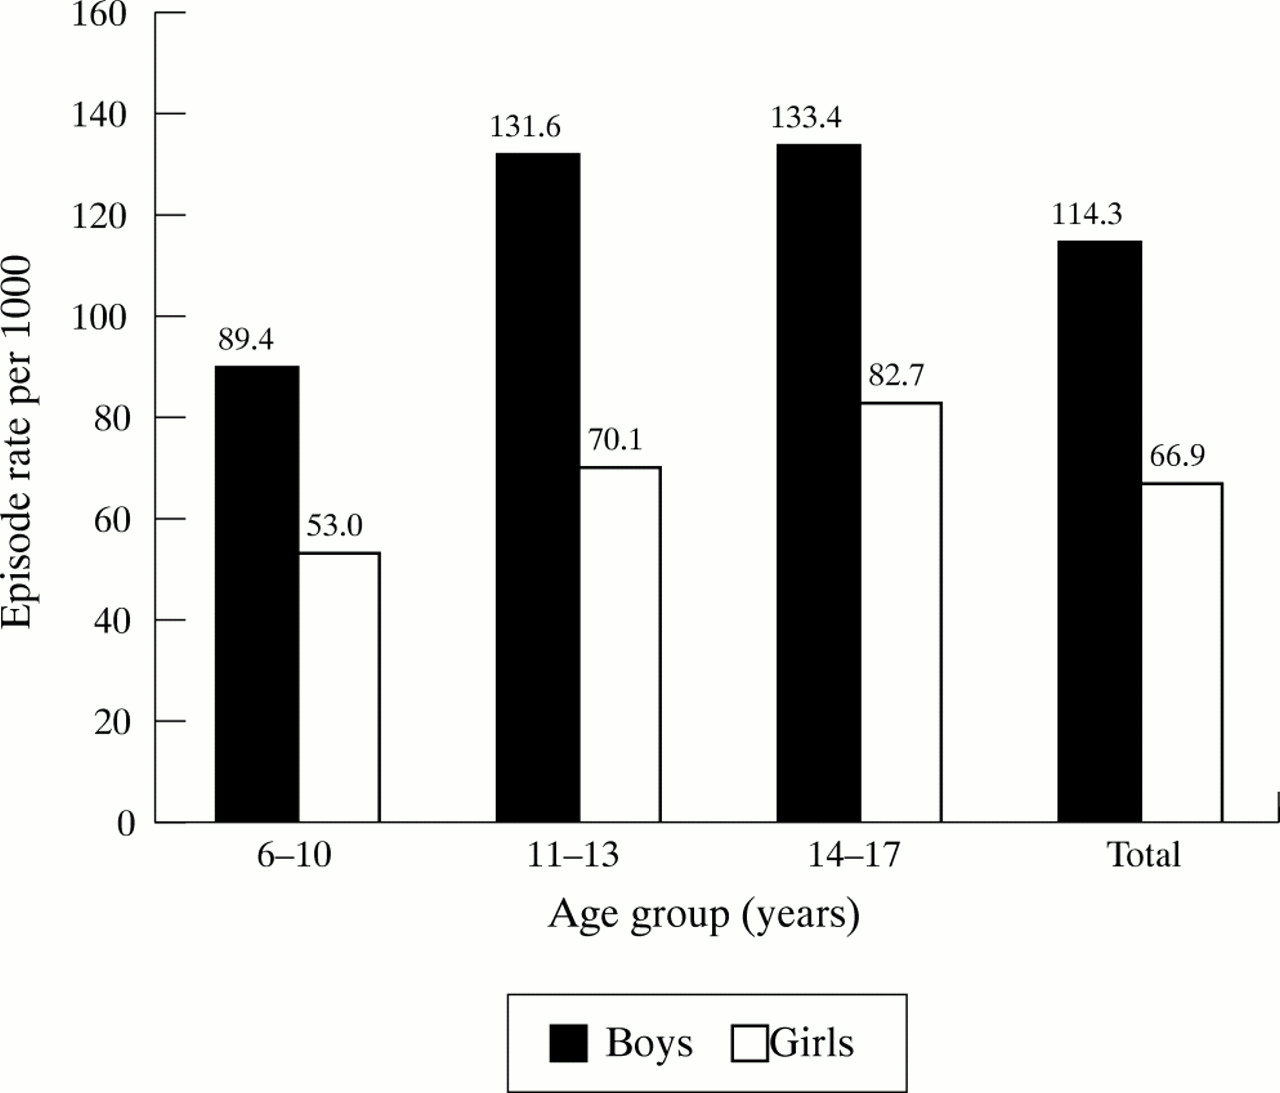
Boys had rates that were almost twice that for girls (p<0.001) (fig 1) in all three age groups. Injury episode rates were similar between children aged 11–13 and 14–17 years, but significantly lower in 6–10 year olds (p values <0.001).

Annualized rate of recreational injury episodes by age and sex among children aged 6–17 years: US, 1997–98.
Table 1 presents the total and age-sex specific episode rates of recreational injury by selected characteristics. The risk for non-Hispanic white children was two times the risk for non-Hispanic black and Hispanic children (p<0.001). A lower rate was found among children living with mother only or living with neither parent as compared to those living with both parents or father only. The difference, however, was not statistically significant after controlling for child age, sex, and family income status (data not shown). The episode rate (per 1000 children) significantly increased from 51.8 in children from poor families, to 80.4 in children from near poor families, and 118.7 in children from not poor families (p<0.001). The same pattern was observed in all age and sex subgroups. A positive linear association was also noted between recreational injury and educational level of adults (p<0.001).
Annualized rate of recreational injury episodes among children aged 6–17 years by selected sociodemographics: US, 1997–98
The age-sex adjusted episode rate (per 1000 children) was slightly higher in the Northeast (98.5) and Midwest regions (102.6) than in the South (85.0) and West (81.6) regions. There was no difference in the rate between rural and urban areas (91.0 and 91.2 per 1000 children, p=0.67).
Injury condition, body region injured, and place of occurrence
The most common conditions resulting from recreational injuries were sprains and strains, followed by open wounds and fractures (table 2). The body regions most often injured were upper and lower extremities, such as ankles, fingers, and knees. The percentage of skull or brain injury was more than twice as high for boys as for girls (10.0% and 3.5%, p<0.001). Most recreational injuries occurred in sport facilities (24.3%), followed by outside a home (23.7%), and in school (21.1%). For children 6–10 years, more than one half of the injuries occurred outside or inside a home, whereas for high school aged children the majority occurred at school and sport facilities (fig 2).
Percentage of injury condition, body region injured, and place of occurrence among children aged 6–17 years: US, 1997–98
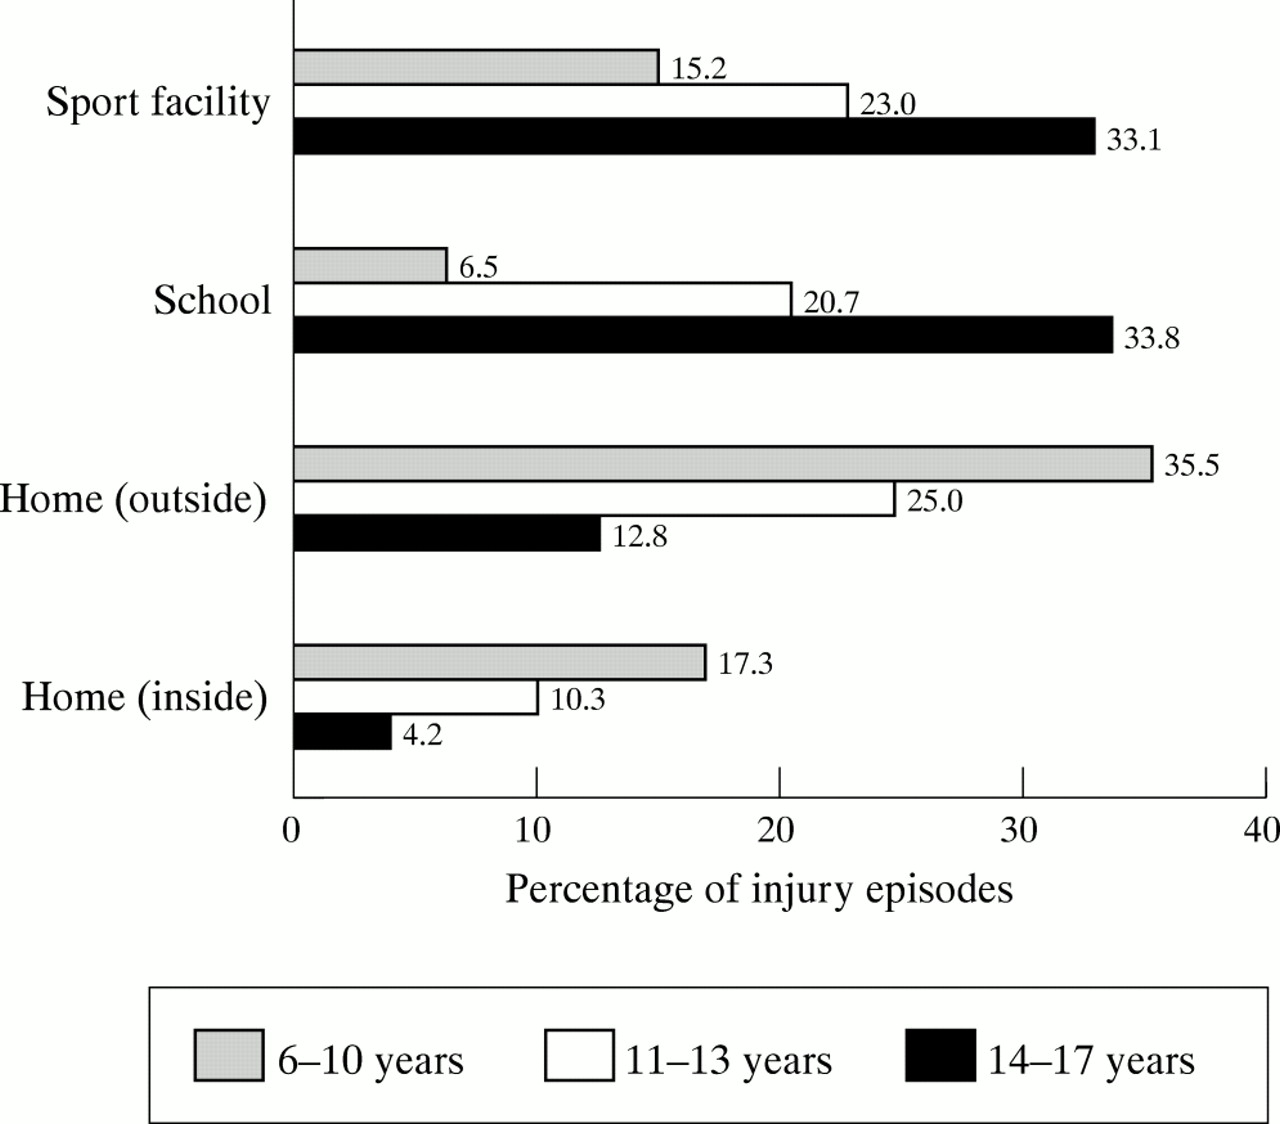
Percentage of recreational injury episodes by selected place of injury occurrence and age group: US, 1997–98.
External cause of recreational injury
Table 3 indicates that the two leading external causes of recreational injuries were falls and being struck by or against a person or an object. The main reasons for falling were slipping, tripping, or stumbling (50.5%), followed by jumping or diving (12.7%) and pushing or shoving by another person (12.4%). Injury episodes caused by cutting or piercing were more common for boys than for girls.
Annualized number and per cent of recreational injury episodes by external cause and sex among children aged 6–17 years: US, 1997–98
Hospitalization, loss of school days, limitation
Most injuries were relatively mild and only 2.2% of the episodes resulted in hospitalization. However, 23.2% resulted in missing school for 1–5 days. The percentage of injuries that resulted in more than one day lost at school was 22.3 for children 6–10, 28.3 for those 11–13, and 22.5 for those 14–17 years.
Recreational injury in relation to socioeconomic status
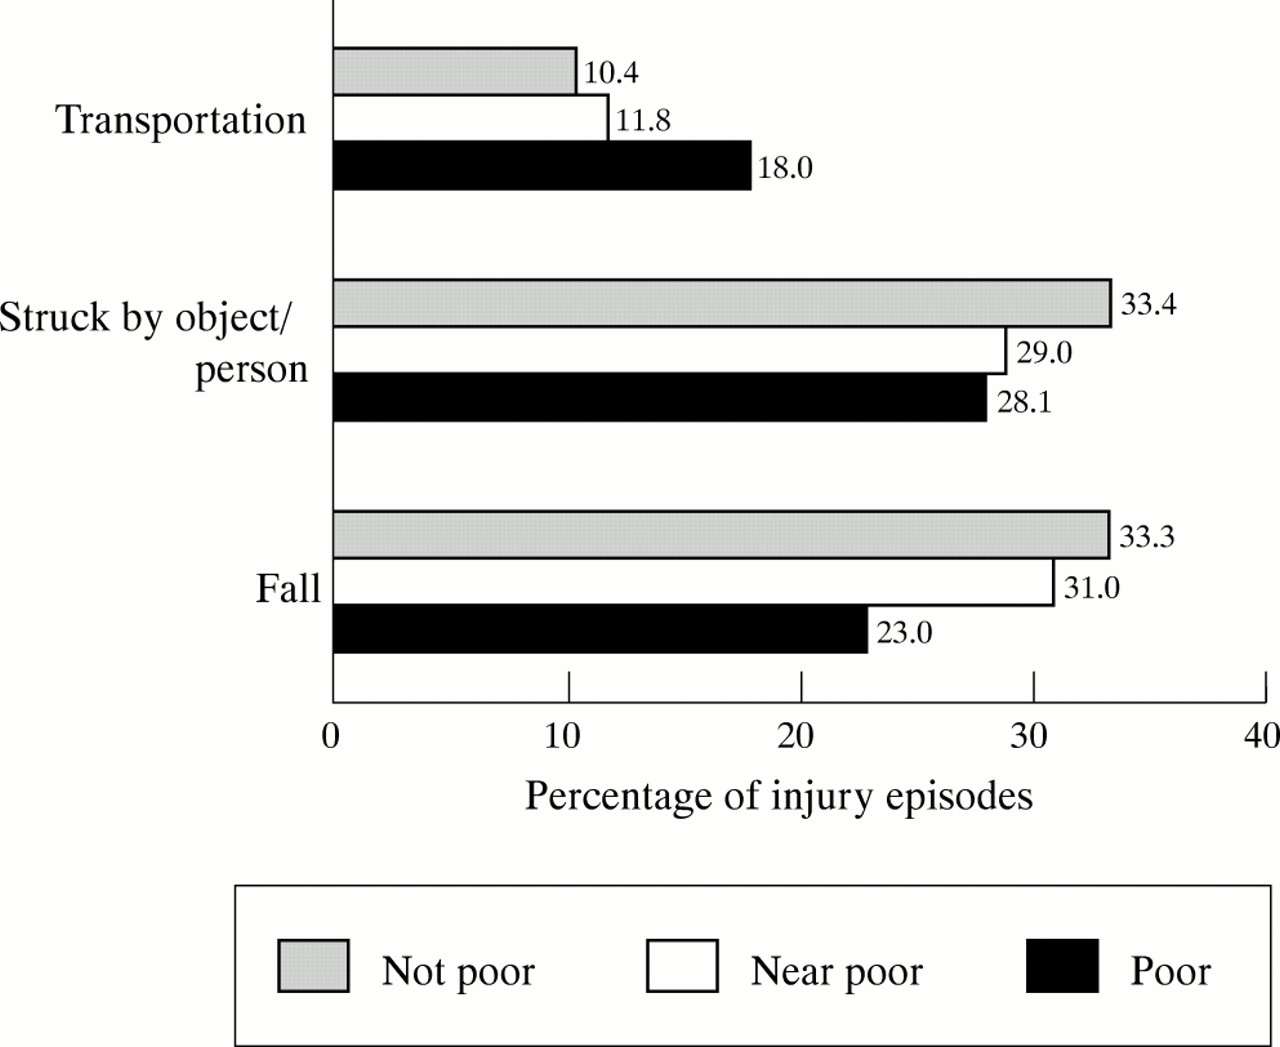
The most common conditions were sprain/strains for children from not poor families and open wounds for children from poor and near poor families (p<0.001) (table 4). The percentages of fractures, however, were similar for the three family income status groups. For children from not poor families, most injuries occurred in sport facilities, whereas for children from poor and near poor families, most occurred outside the home (p<0.001). The per cent of transportation related injury episodes was higher for children from poor families than for those from not poor or near poor families (p values =0.01). In contrast, the per cent of fall related injury episodes was lower among children from poor families than for those from not poor or near poor families (p values <0.001) (fig 3).
Percentage of injury conditions and places of occurrence by family income status among children aged 6–17 years: US, 1997–98
Percentage distribution of recreational injury episodes by major external causes and family income status among children aged 6–17 years: US, 1997–98.
In table 5, model 1 assesses the association between recreational injury and socioeconomic status by including the two socioeconomic status measures while controlling for age and sex. The results revealed a positive association of the occurrence of injury with higher family income and educational attainment greater than 12 years. Model 2 assessed the effect of race/ethnicity on the injury while controlling for age and sex. The risk of recreation injuries for non-Hispanic white children were approximately two times as high as the risk for Hispanic children (odds ratio (OR) 1.9, 95% confidence interval (CI) 1.5–2.6). When all three variables were included in the model, the effect of family income status remained significant, but the magnitude of the association was reduced (model 3) and the effect of education on the occurrence of the injury was no longer statistically significant. Additionally controlling for region and urban/rural residence did not change the results. To eliminate the possibility of under-reporting injuries due to the lack of access to health care, especially among children with lower socioeconomic status, model 4 excluded children without health insurance. The results indicated a consistently higher risk of recreational injury in relation to higher family income status, although the magnitude of the association was further decreased for children from not poor families.
Results from logistic regressions assessing occurrence of recreational injury in relation to socioeconomic status among children aged 6–17 years: US, 1997–98
DISCUSSION
Our results indicate that at least 4.3 million recreational injury episodes occurred each year to school aged children in the US. The actual total number of recreational injury episodes should be higher than the figures presented here, as previous studies indicated that only one fifth to one fourth of injuries in children resulted in seeking medical attention.19,20 Consistent with other studies, we found higher injury rates among boys and older children.21,22 The place of injury shifted from home to school and sport facilities as children became older, reflecting changes in behavioral conditions, recreational activities, and the amount of time spent in these locations.
We observed an increased risk of non-fatal recreational injury in children to be associated with higher level family income. This finding supports several previous studies that reported a positive socioeconomic gradient in injury morbidity for all types of injury,10,21,23 but conflicts with others that showed no indication of this association.8,11 This lack of agreement may be explained by differences in the types of injuries examined. Similar to the study by Williams et al, we observed a socioeconomic variation in the circumstances in which injuries occurred.10 Our results suggested that family affluence may be associated with the injuries that occur in school or sports, while low family income may be associated with the injuries occurring at home or being hit by a car. We found a positive association between recreational injury and socioeconomic status, which may be partly attributable to the greater exposure of children from more affluent families to injury provoking recreational activities that require significant financial investment for involvement. It is noteworthy that in our study the effect of parental/guardian education was attenuated after adjustment for other socioeconomic factors. This result supports the previous finding that differences in income explain more of the variation in health than is explained by other socioeconomic factors.24,25
Interestingly, two previous studies based on NHIS injury data also reported this positive socioeconomic gradient while focusing on all types of injuries.7,21 As the NHIS collected injury information only on cases that resulted in seeking medical attention (or activity restriction for the NHIS before 1997), some have argued that the association could be explained by the lack of access to medical care among people with lower socioeconomic status rather than lower socioeconomic status itself. Families with adequate medical care resources and health insurance have greatly enhanced access to medical care and may be more likely to seek medical attention for minor injuries. Conversely, lack of access to care may lead to under-reporting of minor injuries. This argument was supported by the lower injury rate among people without health insurance from this study and others.21,26 To eliminate this potential bias, our study examined the association by restricting the analysis to children with health insurance and found similar results. Thus, the positive association observed in this study cannot be completely explained by the differences in access to care according to peoples different socioeconomic status. However, low income families, even if they have health insurance coverage, may still be less able to afford to see a physician, miss time at work, or allow their children to stay home from school for minor injuries, which often requires the adult to stay home as well. Therefore, further studies are needed to clarify this issue.
We also identified an increased risk of recreational injury among non-Hispanic white children, after adjusting for family income and educational level. This finding was consistent with the results from two previous studies that found a lower risk of injury morbidity among black and Hispanic adults.7,8 The reason for this racial and ethnic disparity remains unclear. Wagener and Winn observed that working African Americans tended to report fewer injuries requiring medical attention than working white Americans.9 Therefore, the same question could be raised: was this association possibly attributable to less access to care among black and Hispanic people? In our study, the higher risk of injury for non-Hispanic white children remained similar after excluding people without health insurance, suggesting that the racial difference in the risk of recreational injury may not be completely attributable to the difference in access to care among different racial/ethnic groups. The results from our study, however, demonstrated that the higher risk of injury for non-Hispanic white children could be partly explained by family income and educational attainment.
Key points
-
Each year at least 4.3 million recreational injury episodes occurred to school aged children; 23% of children with these injuries needed to take time off school.
-
The leading external causes of the injury were falls and being struck by an object or a person. The most common injury conditions were sprains/strains, open wounds and fractures.
-
The place of injury occurrence shifted from home to school or sport facilities as children became older.
-
Non-Hispanic white children and children from affluent families are at increased risk of recreational injury.
-
For children from not poor families, most injury episodes occurred in sport facilities, whereas for children from poor and near poor families, most injury episodes occurred outside a home.
Limitations
Several limitations should be acknowledged. The first is that, with the intention of increasing recall reliability, the NHIS collected the information only on non-fatal medically attended injuries defined as those that resulted in seeking medical care or advice. As people with poor access to medical care may be less likely to seek medical care after injury, our study may have underestimated the true episode rate of less serious injury among children of lower socioeconomic status.
Another limitation pertains to the quality of self reported medically attended injury data. NHIS data are not validated by reviewing medical records because this would be too costly and time consuming for a nationwide survey. Additionally, it was impossible to find in medical records the injury cases for which only medical advice was sought. On the other hand, self reporting bias, if any, should be non-differential, because there is no evidence to suggest that under-reporting or over-reporting of medically attended injuries is related to socioeconomic status.11 Moreover, as the decision to seek medical attention with an injury is positively associated with socioeconomic status, using injury data derived from medical records may obscure socioeconomic differences in the circumstances in which injuries occur.27–29
IMPLICATION FOR PREVENTION
Our findings suggest that recreational injuries may be reduced by (1) incorporating knowledge of protection from injury into school educational and recreational programs; (2) cautioning parents of younger children about the risk of injury outside and inside their home; (3) teaching children how to protect their upper and lower extremities when falling or being struck by an object/person; and (4) targeting children not only in lower income families, but also in affluent families.
Acknowledgments
The authors thank Wayne Millar of Statistics Canada for his input in developing the initial ideas for this manuscript, Van Parsons of the National Center for Health Statistics (NCHS) for his statistical consultation, and Jane Gentleman, Susan S Jack, Margaret Warner, and Jennifer Madans of NCHS for their helpful comments on the manuscript.
The views expressed in this report are those of the authors. No official endorsement by the National Center for Health Statistics or the Department of Health Human Services is intended or should be inferred.