Article Text

Abstract
Objective—The research was undertaken to describe the injury severity score (ISS) and the new injury severity score (NISS) and to illustrate their statistical properties.
Design—Descriptive analysis and assessment of the distribution of these scales.
Methods—Three data sources—the National Pediatric Trauma Registry; the Massachusetts Uniform Hospital Discharge Data Set; and a trauma registry from an urban level I trauma center in Massachusetts—were used to describe the distribution of the ISS and NISS among injured patients.
Results—The ISS/NISS was found to have a positively skewed distribution and transformation did not improve their skewness.
Conclusion—The findings suggest that for statistical or analytical purposes the ISS/NISS should not be considered a continuous variable, particularly if ISS/NISS is treated as a continuous variable for correlation with an outcome measure.
- injury severity score
- new injury severity score
- trauma
Statistics from Altmetric.com
Injury classification by type and severity is fundamental to the study of its magnitude, distribution, and determinants. Since the late 1960s a number of scales assessing injury severity have been proposed. Introduced in 1971 by a joint committee comprising members of the American Medical Association, the Society of Automotive Engineers, and the American Association for Automotive Medicine (now named Association for the Advancement of Automotive Medicine), the abbreviated injury scale (AIS) was one of the first such scales.1 It is now the most widely reported severity scale, used throughout North America, Europe, Japan, Australia, and New Zealand as a consensus derived anatomically based scale for rating the severity of injuries. The AIS was first published in 1976. Three revisions of the AIS have been published since then (1980, 1985, and 1990).
The AIS and MAIS
AIS-90 classifies more than 2000 injury descriptors into nine body regions (head, face, neck, thorax, abdomen, spine, upper extremities, lower extremities, and external). Each injury is assigned an AIS score on an ordinal scale ranging from 1 (minor injury) to 6 (maximum injury, possibly lethal). In multiple injured patients, the highest AIS is known as the maximum AIS (MAIS). Although MAIS has been used to describe overall severity, evaluations indicated that MAIS was not linearly correlated with the probability of death.2,3 To address these limitations, a derivative of the AIS was developed by Baker et al,4 the injury severity score (ISS).
The ISS
The ISS is also an anatomically based ordinal scale, with a range from 1 to 75. To compute the ISS the nine AIS body regions are grouped into six: head or neck, face, chest, abdominal or pelvic contents, extremities or pelvic girdle, and external. The ISS is then calculated as the sum of the squares of the highest AIS scores for the three most severely injured body regions. For example, if a person sustained multiple injuries to the head, thorax and extremities, and if the most severe injuries in each body region were a closed non-depressed vault skull fracture (AIS = 2), one rib fracture (AIS = 1), and an open tibial fracture (AIS = 3), the ISS would be calculated as the sum of squares of each of these values. An exception to this algorithm happens when any single body region has an AIS of 6, when an ISS of 75 is then assigned. Also, if the severity of an injury cannot be determined an AIS of 9 is assigned. An ISS cannot then be calculated and a score of 99 is given.
The NISS
Recently, researchers have proposed a new injury severity score (NISS) which, unlike the ISS, considers the three most severe injuries, regardless of body region. The NISS is computed as the simple sum of squares of the three most severe AIS (1990 revision) injuries. To date, two studies have reported that the NISS is more predictive of survival and performs better, statistically, than the ISS.5,6
Uses of the ISS
Although the ISS was developed to predict mortality, numerous other applications of the ISS have been reported in the medical literature over the past two decades. For example, researchers have used the ISS to control for patient case mix when evaluating the quality of care of hospital patients admitted with trauma7 and to predict the time it takes for individuals to return to pre-injury levels of functioning.8
Among the studies reviewed for this paper, most treated ISS as a continuous, normally distributed variable.9–15 Others used categorical classifications (for example, binary16–18 or higher order19–21 categories). In studies where the ISS was categorized, there was a lack of consistency in the number of categories and the cut off points selected. Further, researchers concerned that the ISS is not continuous often try to “normalize” the data by logarithmic transformations.9,22,23
The purpose of this paper is to describe the ISS and NISS distributions among several injured populations and to illustrate their statistical properties. Although the former is well discussed, few papers have described their statistical properties using various datasets. Recommendations are made to improve the use of these scales.
Methods
To illustrate the distribution of the ISS and NISS, two steps were taken. First, an algorithm was used to identify all possible ISS/NISS values following the usual rules for its calculation (that is, the sum of the squared AIS values for the three most severely injured body regions, ISS, or the three most severe injuries regardless of body region, NISS). Second, frequency distributions of the ISS from three data sources were performed and using one data source, the distribution was compared to the NISS. To help the ISS and the NISS achieve a normal distribution the effect of the most commonly used transformations for normality (for example, logarithm and square root) were examined.
DATA SOURCES
Three datasets were used: the National Pediatric Trauma Registry (NPTR); the Massachusetts Uniform Hospital Discharge Data Set (UHDDS); and a trauma registry from an urban level I trauma center in Massachusetts. The NPTR receives data from approximately 70 pediatric trauma centers or children's hospitals in the US. It collects demographic characteristics, details of the injury event, and information on clinical interventions for children from birth through 19 years who are admitted to a hospital for acute injury.24 Coding of the information is performed centrally at the NPTR and a variety of injury severity measures are computed including the AIS, ISS, the pediatric trauma score, the revised trauma score, and the Glasgow coma scale. Trained coders at the NPTR manually assign AIS-90 codes from diagnostic information compiled by trauma nurse coordinators at participating facilities. For our analyses, we used cumulative NPTR data recorded between 1 January 1991 and 31 October 1996—a total of 41 579 cases with blunt or penetrating injuries and ISS/NISS values between 1 and 75.
The Massachusetts UHDDS is a population based database collected routinely from all acute care hospitals in Massachusetts. Each facility submits information to the Massachusetts Rate Setting Commission (now called the Health Care Finance and Policy Division) about patient demographics, charges, procedures, source of admission and discharge diagnoses, status, and disposition. For our study we used 1991 data. Trauma cases were defined as patients with a principal diagnosis of International Classification of Diseases (ICD)-9CM code between 800–995 (excluding late effects of injury—codes 905 to 909). We assigned AIS and ISS scores by means of a computerized algorithm developed and validated by MacKenzie et al that links ICD-9CM discharge diagnoses to AIS-85.25 This yielded a total of 41 928 discharges with ISS between 1 and 75.
The third database is the trauma registry of an urban level I trauma center in Massachusetts. The trauma registry collects data on all trauma admissions and deaths in the emergency department, including information on demographics, details of the injury event, and clinical interventions. Using diagnostic and other medical information in the medical record, a trained trauma registrar manually assigns AIS-90, from which ISS values are calculated. A total of 1975 cases with ISS values between 1 and 75 who were discharged from the trauma center during 1993 were used in our analysis.
Only one data source, the NPTR, was used to compare the distributions of the ISS and NISS.
Results
The first part of the analysis describes all possible ISS/NISS values. Table 1 illustrates the lack of continuity of these values. The algorithm generated 44 valid values and 31 non-valid (that is, non-existing) ISS/NISS values along the interval 1 to 75. The non-valid values are denoted as N/A in table 1.
All possible ISS/NISS with the number of body regions injured and values of AIS necessary to generate them (non-valid ISS/NISS values denoted as N/A)
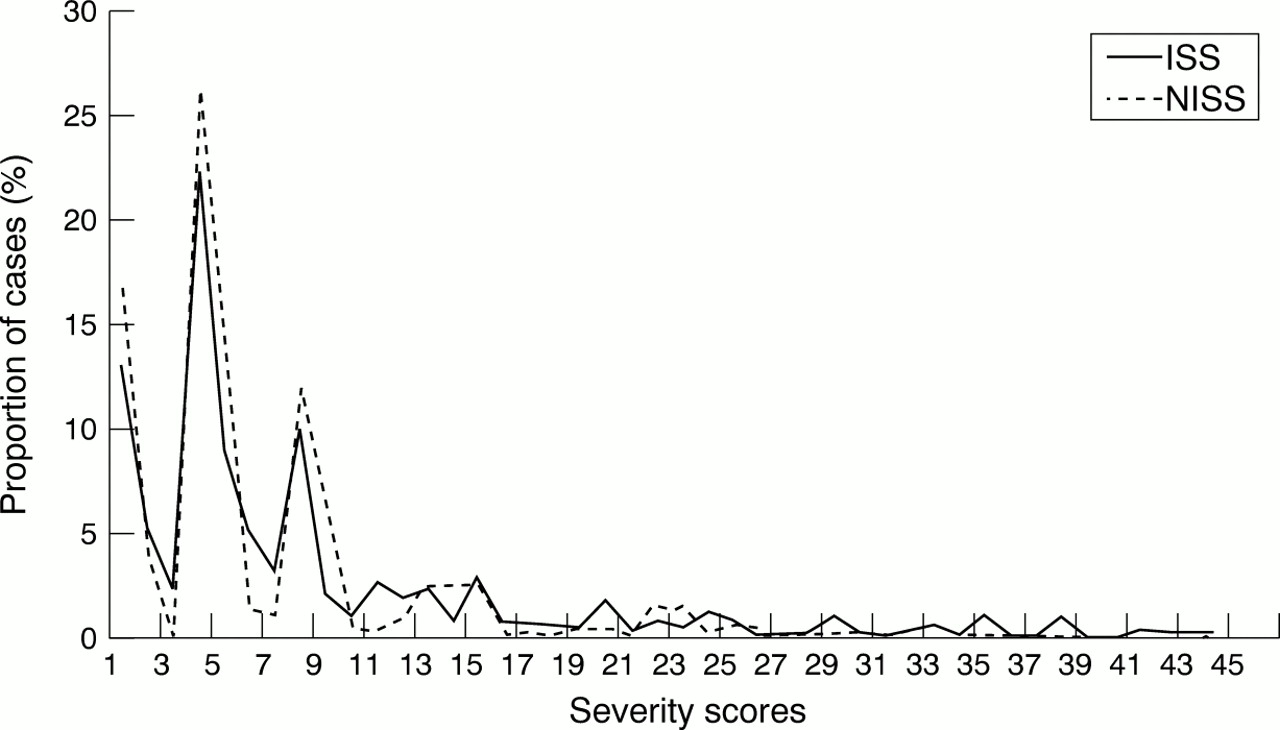
Figure 1 depicts the distributions of ISS. Examination of this figure showed that the distribution of ISS is similar among the three data sources and for the two different versions of AIS (AIS-85 and AIS-90). Since the distribution for ISS was similar among the three data sources, only one data source (NPTR) was used to compare the distribution of the ISS and NISS. It is evident from fig 2 that the distribution of ISS and NISS were almost identical with both distributions positively skewed.

Frequency distribution of injury severity scores (ISS) in three datasets. NPTR = National Pediatric Trauma Registry (ISS derived from AIS-90); UHDDS = Massachusetts Uniform Hospital Discharge Data Set (ISS derived from AIS-85); trauma registry ISS derived from AIS-90.

Distribution of ISS and NISS using data derived from the National Pediatric Trauma Registry.
The effects of the peaks at ISS (and similarly NISS) values 1, 4, and 9 in figs 1 and 2 are explained by the fact that these patients had incurred injuries in only one body region with an AIS severity of 1, 2, or 3, respectively. The troughs of the distribution were at ISS (and the respective NISS) values of 3, 7, 11, and 15. Two of these troughs (7 and 15) are a result of a non-valid ISS value; the other two troughs (3 and 11) are due to the too few patients classified with these values. To obtain an ISS value of 3, a trauma patient would need to have suffered multiple minor injuries (AIS = 1) in at least three different body regions (or the same body region in relation to the NISS; see table 1). For a patient to have an ISS = 11, he or she would have sustained at least two minor injuries (AIS = 1) in two body regions and a serious injury (AIS = 3) in a third body region (see table 1). The ISS/NISS distribution reached a plateau after the ISS/NISS value of 19 due to the too few cases with injury diagnoses in two body regions (or the same body region but separate injury diagnoses) with AIS value of 3 of higher. In the NPTR dataset, only 8% and 6% of cases exceeded an ISS or NISS value of 19, respectively.
Transformation of the ISS data (as well as the NISS data) did not alter the skewness of the distribution. Logarithmic transformation for the ISS and NISS data along with other transformations (such as the squared root) are available from the authors upon request.
Table 2 summarizes the distribution of patients using measures of central tendency as well as breaking ISS and NISS into categories based on injury severity. Measures of central tendency obscured differences among the data sources. Despite the same median ISS values for the three databases and similar mean values, there were distinct differences in the proportion of severely injured trauma cases among the three databases. Fifteen per cent of the NPTR and trauma registry trauma cases sustained injuries of ISS 16 or greater as compared with only 5% of UHDDS trauma cases in this category. Comparison of the ISS and NISS data from the NPTR data source showed almost the same distribution, although the mean NISS score was slightly higher.
Distribution of patients by injury severity (ISS) in three data sources and the comparison with NISS
Discussion
This study showed that the pattern of the ISS distribution was similar among the three databases and between the ISS and NISS both regarding its marked skewness as well as the distribution of the scores. The finding that the transformations did little to make the ISS or NISS resemble a normal distribution in the available datasets was not surprising given their excessive skewness and the fact that the ISS/NISS is an ordered categorical variable. Of interest, however, was that the distributions themselves had similar means and medians especially if one considers that the three datasets used to describe the distribution of ISS differed from one another in several respects: case inclusion criteria, the manner in which data were collected and coded, version of AIS used, methods for AIS computation, and the size of the datasets. In contrast, if the severity distributions are described in terms of the proportions of individuals above or below some threshold score, the ISS distributions for the three datasets are not alike.
The shape of the ISS/NISS distribution has several implications for the choice of analytical procedures. Numerous researchers have used the mean ISS as a way of describing and comparing injury severity in populations.11,13–15,26 Since the ISS (or the NISS) is not normally distributed, reporting the mean ISS (the least robust measure of central tendency), may lead to incorrect interpretations. For example, the mean ISS value in the NPTR dataset was 7. Apart from the fact that 7 is not a valid ISS value, almost two thirds (63%) of the sample have an ISS value lower than 7. Use of the mean ISS may also be misleading when comparing values from different populations. As highlighted in table 2, the three data sources for the ISS and the one used for the NISS had similar means and identical medians, although the tails of their distributions were dissimilar. For example, the proportion of severely injured cases (ISS and NISS 16 to 24) in the NPTR and trauma registry databases was two times higher than that of the Massachusetts UHDDS. Differences in the tails of the distribution are important when comparing cost and outcomes among facilities.
Two possible explanations for the observed differences in these datasets may be: differences in the populations, and the fact that the computerized algorithm used to calculate AIS and ISS for the Massachusetts UHDDS data underestimates severity. Despite the explanations for the observed differences, only by presenting ISS as a categorical variable could the differences in the distributions be observed. Since the NISS uses the same scale as the ISS, the same findings apply to the descriptive interpretation of the NISS data. Thus, we suggest that for analytic purposes, neither the ISS and NISS be considered a continuous variable. This is because it is a collection of discrete values (that is, there are not an infinite number of values between any two integers) and that along the range of ISS/NISS values (from 1 to 75), there are several integer values that are not possible.
From a review of the literature it was evident that there was no consistency in the number of categories used or the severity cut off points when ISS was used as a binary or ordered categorical variable.16–21 There is no simple solution to the categorisation of the ISS (or NISS) and the establishment of a committee to develop clinically meaningful dichotomization and categorization of ISS (or NISS) may do little to rectify this issue. In part, this is due to the fact that the most meaningful categorization may differ from study to study and the “best fit” (in relation to the application of these categories in multivariate modeling) will always depend on the given set of data. However, for comparative purposes, we believe that it would be advisable to agree to a standard categorization scheme that could be reported in addition to any project specific categorization.
Acknowledgments
This research was supported in part by grant # from the Centers for Disease Control (MS, MS-G, IL) and by grant #H133850006 from the National Institute on Disability and Prevention (CDS).