Article Text

Abstract
Objectives—To examine the relationship between the magnitude, and the relative importance of unintentional child injury mortality with socioeconomic development, and to conceptualise the dynamic changes in injury mortality within the framework of epidemiological transition.
Design—Ecological cross sectional study using data on 51 countries.
Main outcome measures—The relationship between total mortality rates, unintentional injury mortality rates, and percentage in children 1–14 years of age with gross national product (GNP) per capita.
Results—Unintentional injury mortality rates in children were negatively correlated with GNP per capita. However, by categorising the data, we found some areas of non-correlation: in children 5–14 years in low income versus lower middle income countries, and in all age and gender groups in lower high income versus higher high income countries. A high percentage of total deaths due to injuries was clearest in the lower middle income countries in all age and gender groups.
Conclusions—The changes in child injury mortality in relation to socioeconomic development could be conceptualised as three stages: a stage of high magnitude; a stage of high priority; and a stage of improvement. Most middle income countries are in the high priority stage where both injury mortality rates and injury percentage of total deaths are high.
- child mortality
- developing country
- epidemiological transition
- middle income country
Statistics from Altmetric.com
To understand the dynamic changes in health status and mortality in relation to socioeconomic development, it is necessary to refer to the theory of epidemiological transition originally described by Omran.1 Three stages of epidemiological transition were first proposed: the stage of pestilence and famine in pretransitional society, the stage of receding pandemics, and the stage of degenerative and manmade diseases in post-transitional society. In 1986 Olshansky and Ault added the fourth stage, to describe the current transition in developed countries, in which a decrease of mortality in degenerative and manmade diseases in the young and middle age was found.2 In this stage, the concerns are not only of mortality but also burdens of disability. The new health indicator that combines the burden of fatal and non-fatal health outcomes, the so called disability adjusted life year (DALY), has been proposed.3
In the third stage in developed countries, when child injury was recognised as a major public health problem, success in controlling injury mortality was achieved.4–8 Berfenstam identified injury as a leading cause of child death in Sweden in 1956 and this led to the creation of several prevention programmes using a multidisciplinary approach.4 Marcusson and Oehmisch studied global trends in childhood injury mortality between 1950 and 1971 and found that injury was responsible for more than 40% to 50% of all child deaths in industrialised countries and fewer than 10% in developing countries.5 Taket stated that childhood injury mortality rates decreased in the period 1971 to 1981 in Europe, North America, Australia, and Oceania in all age and gender groups.6 More specifically, Jansson and Svanström illustrated that the death rates from unintentional injuries among children in Western European countries decreased by more than 50% from 1970 to 1988.7 In contrast, increasing mortality rates were found in Eastern Europe, Asia, and Latin America, mainly consisting of developing countries.6–8
In the last decade, many developing countries have experienced an improvement of socioeconomic status and a rapid decline in child mortality. They are entering into the third stage of epidemiological transition as did the developed countries in the early part of this century. Is injury in such countries emerging as the leading cause of child death? If so, has injury mortality increased in crude rates or only as a percentage of total deaths due to a decline of other diseases? Among developing countries, there are various stages of socioeconomic status. Which countries should give priority to injury prevention in their child health care policies?
This paper explores these questions by analysing the correlation of the magnitude and relative importance of child injury mortality with gross national product (GNP) per capita as an index of socioeconomic status. We also try to conceptualise the dynamic changes in child injury mortality within the framework of epidemiological transition.
Methods
STUDY POPULATION
Data for 1993 (or the closest preceding or subsequent year for the period of 1991–94 if information was unavailable for 1993) of all countries reported in World Health Statistics Annual were obtained.9 Some were excluded according to the following criteria: no data on total population in each age group; too small population size (fewer than 1 million); or inaccurate data on GNP. Overall, 51 countries were used as the study population (table 1). Of these, 18 countries (35%) were former socialist countries and 16 (31%) were industrialised European countries. The others (34%) included one from Africa, five from East Asia and the Pacific, seven from Latin America, two from North America, and two from Australasia. The 51 countries were categorised into five income based country groups according to GNP per capita. The definition, mean of GNP per capita, and mean of mortality rates of children under 5 in each group, are shown in table 1.
Definition and abbreviation of income based country groupings and mean of GNP per capita, under 5 mortality (U5MR) of each group
Unintentional injury was defined as E800–949 (accident and adverse effects) in the International Classification of Diseases, ninth revision (ICD-9) or ICD-8. GNP per capita for the same year was obtained from the world table 1995 (World Bank) and the State of the World's Children (Unicef).10, 11
STUDY DESIGN
Child injury mortality and socioeconomic development
A scatterplot of unintentional injury mortality rates in 51 countries and the GNP per capita were compiled by age and gender. Using log-log axes, a linear correlation was observed and linear regression analysis performed according to the following model: Where Y = unintentional injury mortality rate (/100 000); X = GNP per capita (US $); i = age group (1–4 and 5–14 years); k = gender (male and female).
Child injury mortality rates and percentage of total deaths by income based country groupings
Fifty one countries were categorised into five income based groups (table 1). Mean and 95% confidence interval (CI) of total mortality rates, unintentional injury mortality rates, and percentage of total deaths due to injury in each group were calculated. The significant difference in mean (p<0.05 or p<0.01) between contiguous groups was calculated by Student's t test. The percentage or proportion of total deaths due to injury, also called proportionate mortality ratio, was used to determine the relative importance of the problem in each group.8
Results
The scatterplot of the relationship between unintentional injury mortality rate and GNP per capita of 51 countries using the log-log model (fig 1) shows the negative linear correlation of the two variables in all age and gender specific groups.
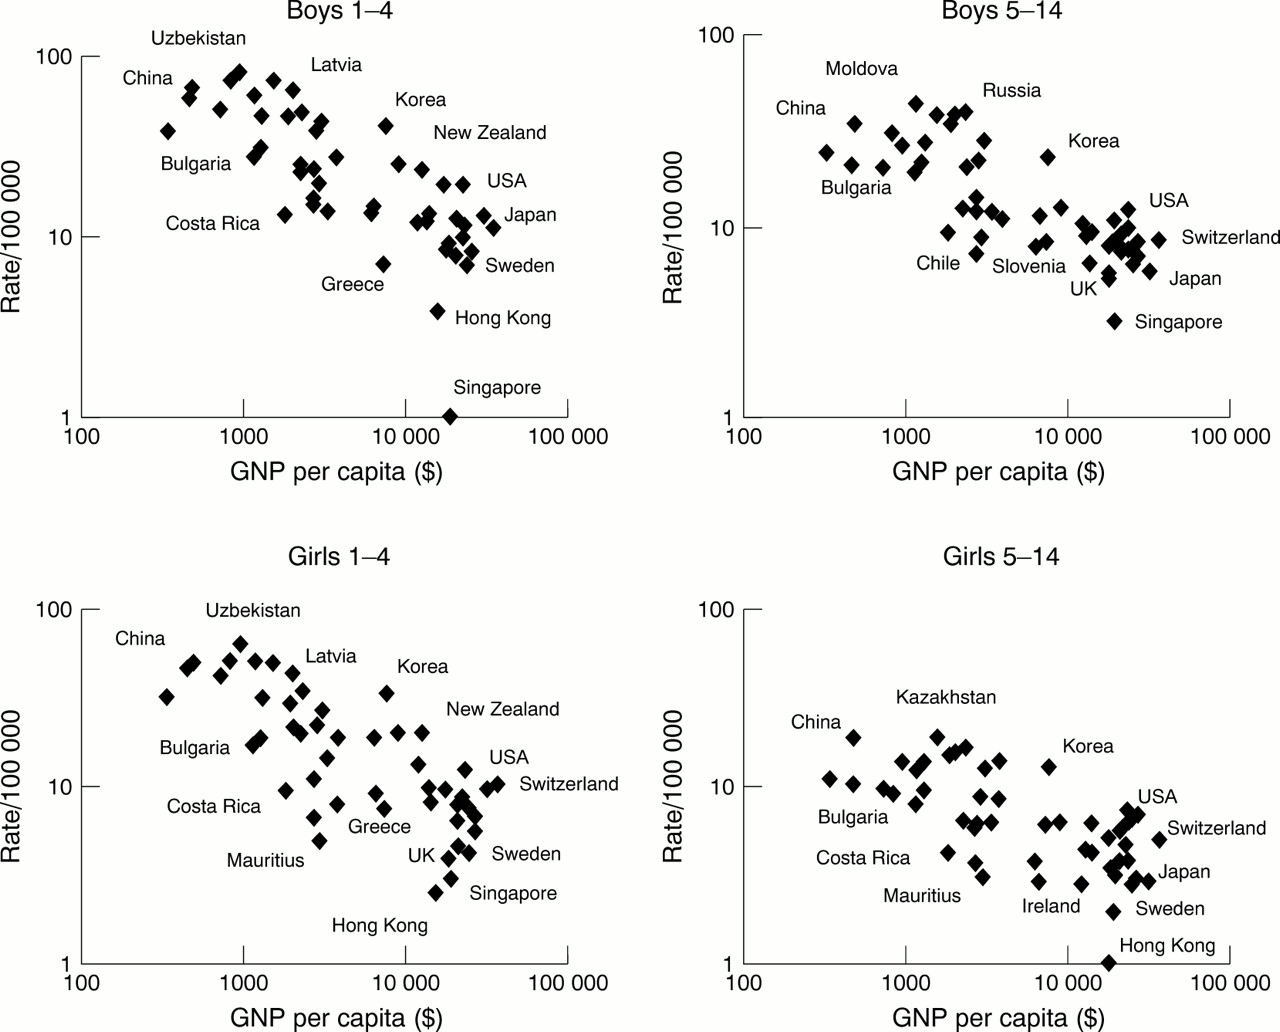
Relationship of GNP per capita and unintentional injury mortality rate in 51 countries by age and gender, 1993.
Using linear regression analysis, the correlation of injury mortality rates with GNP per capita in each gender and age group is shown in table 2 and fig 2. Data on Singapore for 1–4 year old boys and Hong Kong for 5–14 year old girls were considered as outliers. Four trend lines for age and gender specific groups in fig 2 show age and gender income differentials. Lower income, male, and younger age group are consistently related to higher injury mortality. According to the model, when GNP per capita doubles, there will be a corresponding decrease in injury mortality by factors of 0.72 and 0.71 in boys and girls aged 1–4, and by factors of 0.77 and 0.81 in boys and girls aged 5–14, respectively. Male mortality rates were higher than those for females in both age groups at any income level. The trend in girls dropped more steeply than in boys in the younger age group (β = −0.491 and −0.464) but less in the older age group (β = −0.313 and −0.374). Within the same gender, the younger age group had higher mortality rates than the older one at any income level. However, the trend lines for younger age groups declined more steeply than for the older groups, causing the ratios between injury mortality in 1–4 year olds and 5–14 year olds to be lower at higher income levels.
Regression analysis results of injury mortality rates and GNP per capita by age and gender groups, 1993

Scatterplot, trend lines, and regression analysis results of injury mortality rates and GNP per capita by age and gender specific groups, 1993.
Injury mortality and percentage of total deaths by income based groupings
For children aged 1–4, by income based country grouping (table 3), the decline in total mortality and unintentional injury mortality trends is related to an increase in the GNP per capita. However, total mortality decreased markedly between low income and lower middle income countries—by 68% of the mean difference for boys (p<0.01) and 72% for girls (p<0.01)—while injury mortality decreased by 29% for boys (p=0.076) and 36% for girls (p<0.05). These caused the percentage of injury mortality to increase from 21% to 39% for boys (p<0.05) and 18% to 36% (p<0.05) for girls. Injury mortality rates, however, declined rapidly in the higher middle income countries, by around 50% for both sexes (p<0.01). Figure 3 shows clearly that for 1–4 year old boys total mortality dropped more steeply than did the injury mortality in low income and lower middle income countries, causing the highest injury percentage to be found in lower middle income countries. The figure in girls showed the same pattern as boys (not included in this paper).
Mean and 95% CI of unintentional injury mortality rates (/100 000), total mortality rates and the percentage of total deaths due to injuries by income based country groups, age and gender in 51 countries, year 1993

Mean and 95% CI of unintentional mortality rates, total mortality rates, and the percentage of total death due to injuries by income based country groups and age and gender specific groups, 1993.
For children 5–14 years old, even in low income countries, unintentional injury deaths accounted for about 28%–40% of total deaths. In contrast to the younger age group, the trends of total mortality between low income and lower middle income countries decreased slightly, while injury mortality was slightly worse in both genders. Thus, the percentage of injury death rose to 50% in boys and 36% in girls. The highest percentage of injury deaths in all deaths was found in lower middle income countries (fig 3), whereas both injury deaths and total deaths significantly declined in higher middle income countries. Even though there was no significant difference between lower high income countries and higher high income countries, the higher injury mortality and injury percentage in girls in the higher high income countries was seen. These trends persisted even though data for Singapore and Hong Kong were excluded.
Discussion
We found a negative relationship between injury mortality rates and socioeconomic development in children aged 1–4, whereas in 5–14 year olds a significant negative correlation was observed only for middle and high income countries. We also found that the relative importance of injuries as a percentage of total deaths was highest in middle income countries in those with a GNP per capita $1000–$2500 for all age and gender groups.
This is an ecological study and therefore has inherent weaknesses. A general trend that holds true for aggregated countries does not necessarily hold true in the individual country. However, in the situation where some countries lack even basic data to assess priorities for public health, the use of readily available data in ecological design to identify high risk countries that need further individual focus is useful. Instead of linear regression alone, combining with analysis of categorical variables serves better for identifying high risk groups.12
In this study GNP per capita was used as an index for socioeconomic development. GNP measures the total domestic and foreign value added claimed by the residents of a country.13 It comprises gross domestic product plus net factor income from abroad. This includes foreign assistance and contributions. In fact, GNP per capita does not, in itself, measure success in development. Some measures are more representative, such as energy and newsprint consumption.14 In addition, poor distribution of development leading to social inequity, typical socioeconomic development for middle income countries, described by Frenk et al as epidemiological polarisation, has to be taken into account.15 Social inequity has a remarkable effect on child survival and is not reflected in GNP per capita.15, 16 The differences in the content of socioeconomic change that may be associated with injury risks, such as industrialisation, urbanisation and mode of transportation, should also be taken into account.17 Söderlund and Zwi studied traffic related mortality using cross sectional data from 83 countries and found the initially positive relationship with GNP per capita became negative at higher levels.18 Middle income countries, with a GNP $4000–10000, appear to have the greatest road traffic mortality burden. Carey et al studied the relationship between geographical variations and child injury mortality in New South Wales and found a significantly higher rate in rural compared with metropolitan areas.19
The validity of data is the main problem in any international comparisons of injury. In this study we used only one main data source from the World Health Organisation where the validity of information was reported and the range of estimated coverage is 87%–100%.9 However, the distribution of our study population remains a problem. We have only six low income countries (11%) and only 35% of non-European and non-former Soviet Union countries. This causes difficulties as to the generalisibility of the results. Some of the study countries are from the former Soviet Union where an epidemiological crisis was experienced. However, this mainly affected middle age men, not children under 15 years.20
CONCEPTUALISATION
The dynamic change in injury mortality as a component of child health status with regard to socioeconomic development can be conceptualised as three stages. The first stage, that of high magnitude-low relative importance, is presented in most low income countries, which are in epidemiological transition stage 1–2.1 Here the major killers are infectious diseases, prenatal problems, and nutritional deficiency. Child injury mortality rates are highest compared with other stages and the majority of injury deaths are in children aged 1–4. Nevertheless the importance of the injury problem in this stage is relatively low. In the 5–14 age group, injury deaths account for 30%–40% of all deaths; nevertheless, total deaths in the younger groups are five times more. The main task is still to combat all traditional diseases in the younger age group. However, the predicted increase in the relative importance of injury mortality emphasises the need for early concern in injury prevention. For example, any plans to adopt high energy developments, such as high speed methods of transportation, should be preceded by careful safety analysis and impact evaluation.
The second stage, that of high priority, is found in developing countries, mainly in middle income countries. When socioeconomic status develops from low income to middle income, total mortality in the 1–4 year age group rapidly declines. The proportion of deaths in the 5–14 year age group is higher. This corresponds to the early third stage of epidemiological transition.1 Injury deaths in young age groups also decline, but less than total mortality. Meanwhile, injury deaths in school aged children seem to be rising. Thus, a dramatic success in controlling other causes of death among young children, a shift in the age structure of mortality, and a rising trend in injury magnitude in older age groups lead to a marked increase in the relative importance of injury. Compared with the other stages, injury death in the second stage accounts for the highest percentage of total deaths. To immediately achieve improved child survival, these countries must focus on reducing child injury deaths as a priority.
The third stage, that of improvement, seems to appear initially in the higher middle income countries. The decline of injury mortality rates is found in all age and gender groups and plays a major part in the reduction of total mortality. This corresponds to the fourth stage of epidemiological transition.2 The improvement of injury deaths in 5–14 year olds is less than in the younger groups. The ratios of injury death between younger age groups and older age groups are approaching one.
In European countries during the period 1950–71, Marcusson and Oehmisch found a pattern of child injury mortality similar to that of the second stage.5 This implies a continuous decline of injury mortality rates in the 1–4 year age group, an increase rates in the 5–14 year olds, and an increasing trend in the proportion of injury deaths for all age and gender groups. Taket illustrated the stage of improvement in industrialised countries during the period 1970–81 as did Jansson and Svanström for Western European countries.6, 7 Concerning specific causes of injury death, drowning mortality accounted for a major proportion in the first stage, mainly in younger children, followed by a substantial decline during the stage of improvement.6–8, 21, 22 Motor vehicle accidents emerged as a leading cause in the third stage, mainly in older children.6–8, 18 Both drowning and motor vehicle accidents appear to be the burden of countries in the second stage.
HOW TO DEAL WITH INJURY IN THE STAGE OF HIGH PRIORITY IN MIDDLE INCOME COUNTRIES
While child injury has emerged as the leading cause of child death in middle income countries, public awareness has slowly grown. To improve child survival in such countries, injury prevention could play a crucial part if health care sectors and medical academics recognised injury as a major child health problem. Expanding the field of social paediatrics might create a body to strongly influence this problem.7 Research to determine appropriate and effective preventive measures should be conducted. Nationwide selective injury prevention programmes might substantially improve the high mortality rates from a leading cause, for example, Gorbachev's antialcohol programme.20 The comprehensive community approach aimed at empowering the local community is shown as an effective programme for child safety promotion.23, 24 However, given global inequalities in injury mortality among children in this study, differentials between social classes within each country should be taken into consideration before resetting the health care priorities.
Conclusions
Concerning the dynamic changes in child injury mortality, lower middle income countries are in the stage of high priority where both injury mortality rates and injury percentage of total deaths are high. To improve child survival in such countries, injuries must be presently recognised as a major child health problem. For low income countries, to leapfrog the predicted increase in child injury mortality, early action, rather than waiting for injuries to take their toll before beginning to respond with appropriate policy, should be considered.
Acknowledgments
The authors wish to thank Karen Leander, Department of Public Health Sciences, Karolinska Institute for her efforts in the correction of the English and Pichai Tangsin, Health Information Division, Ministry of Public Health, Thailand, for his participation in the data collection and his valuable comments.