Article Text

Abstract
Background Epidemiological characteristics and recent trends in unintentional drowning at the national level in China are unreported.
Methods Using data from the Disease Surveillance Points system, the overall, sex-, location-, age- and cause-specific age-standardised mortality from unintentional drowning in China were calculated and compared. Linear regression was used to examine the significance of mortality trend changes over time.
Results The average mortality was 4.05 per 100 000 persons between 2006 and 2013. Men and rural residents had much higher drowning mortality rates than women and urban residents at all time points. Drowning following a fall into natural water was the most common mechanism (46% of all drowning deaths). The overall drowning mortality rate remained stable for all subgroups except for distinct decreases in urban residents, children aged 5–9 years, and other specified and unspecified drowning (−10%, −36% and −25%, respectively).
Conclusions The overall drowning mortality rate remained high and stable in China between 2006 and 2013. Effective prevention measures like removing or covering water hazards, wearing personal floatation devices, supervision of children, and teaching survival swimming and resuscitation skills should be implemented nationwide.
- drowning
- characteristics
- trend
- mechanism
- China
This is an open access article distributed in accordance with the Creative Commons Attribution Non Commercial (CC BY-NC 4.0) license, which permits others to distribute, remix, adapt, build upon this work non-commercially, and license their derivative works on different terms, provided the original work is properly cited and the use is non-commercial. See: http://creativecommons.org/licenses/by-nc/4.0/
Statistics from Altmetric.com
Introduction
According to recent Global Burden of Disease (GBD) estimates, about 63 724 persons died from unintentional drowning in China in 2016, accounting for 21% of global drowning deaths.1 As is common for many low-income and middle-income countries,2 epidemiological characteristics of drowning deaths have not been reported nationally for China.
The limited published evidence from China were conducted in single provinces or cities to report drowning mortality3–6 or explore risk factors for non-fatal drowning among children.7 8 These studies indicate that men and rural children have higher drowning risks than women and urban children in China3 5; that most drowning deaths occur in natural water; and that swimming, playing and diving in natural water are the leading causes of non-fatal drowning.7 8 No published studies report epidemiological characteristics of unintentional drowning in China at the national level.
Using nationally representative mortality data from the Disease Surveillance Points system (DSPs) of China,9 we examined epidemiological data and trends from 2006 to 2013 for unintentional drowning mortality by location (urban/rural), sex, age group and mechanism of drowning in China.
Methods
Mortality data were derived from the DSPs. Details of the DSPs methodology are available elsewhere,9–13 but briefly, the DSPs was created in 1978 and expanded to include more surveillance points in 2004–2006 and again in 2013.11 A web-based data collection approach was introduced for the DSPs in 2008.12 The DSPs uses trained individuals from local hospitals or CDC offices to code the cause of deaths using a standard protocol. The 10th International Classification of Diseases (ICD-10) has been used for the DSPs since 2004. A routine quality check system evaluates timeliness, completeness and accuracy of data reporting.9 A national sample survey is conducted every 3 years at all DSPs locations to correct possible under-reporting.13 To ensure comparability across years, for this study we used data from only the 161 surveillance points available beginning in 2006.
Based on the ICD-10, we limited drowning to codes W65–W74. Location (urban/rural), sex, age group and mechanism of drowning were considered in our analysis. We distinguished urban from rural areas using DSPs’ urbanisation criteria, which specify that districts within prefecture-level cities (typically, cities with 1 million or more inhabitants) are defined as urban areas, while counties and county-level cities are defined as rural areas.14 Based on preliminary analysis (not shown here), we divided age into five groups: 0–4 years, 5–9 years, 10–14 years, 15–59 years, and 60 years and older. We combined codes with extremely few deaths into a single group and therefore classified the mechanism of drowning into four categories: (1) drowning occurring in bathtubs and swimming pools (W65–W68), (2) drowning occurring in natural water (W69), (3) drowning following fall into natural water (W70) and (4) other specified and unspecified drowning (W73–W74).
Age-adjusted mortality rates were calculated using the national census population in 2010 as the reference. Linear regression was used to examine the significance of trends in mortality for different subgroups. The percent change in mortality between 2006 and 2013 and 95% CIs were calculated as ‘(mortality in 2013–mortality in 2006)/mortality in 2006×100%’ using negative binomial regression. P <0.05 was considered statistically significant. This analysis was approved by the ethics committee of Xiangya School of Public Health, Central South University (No. XYGW-2017-01).
Results
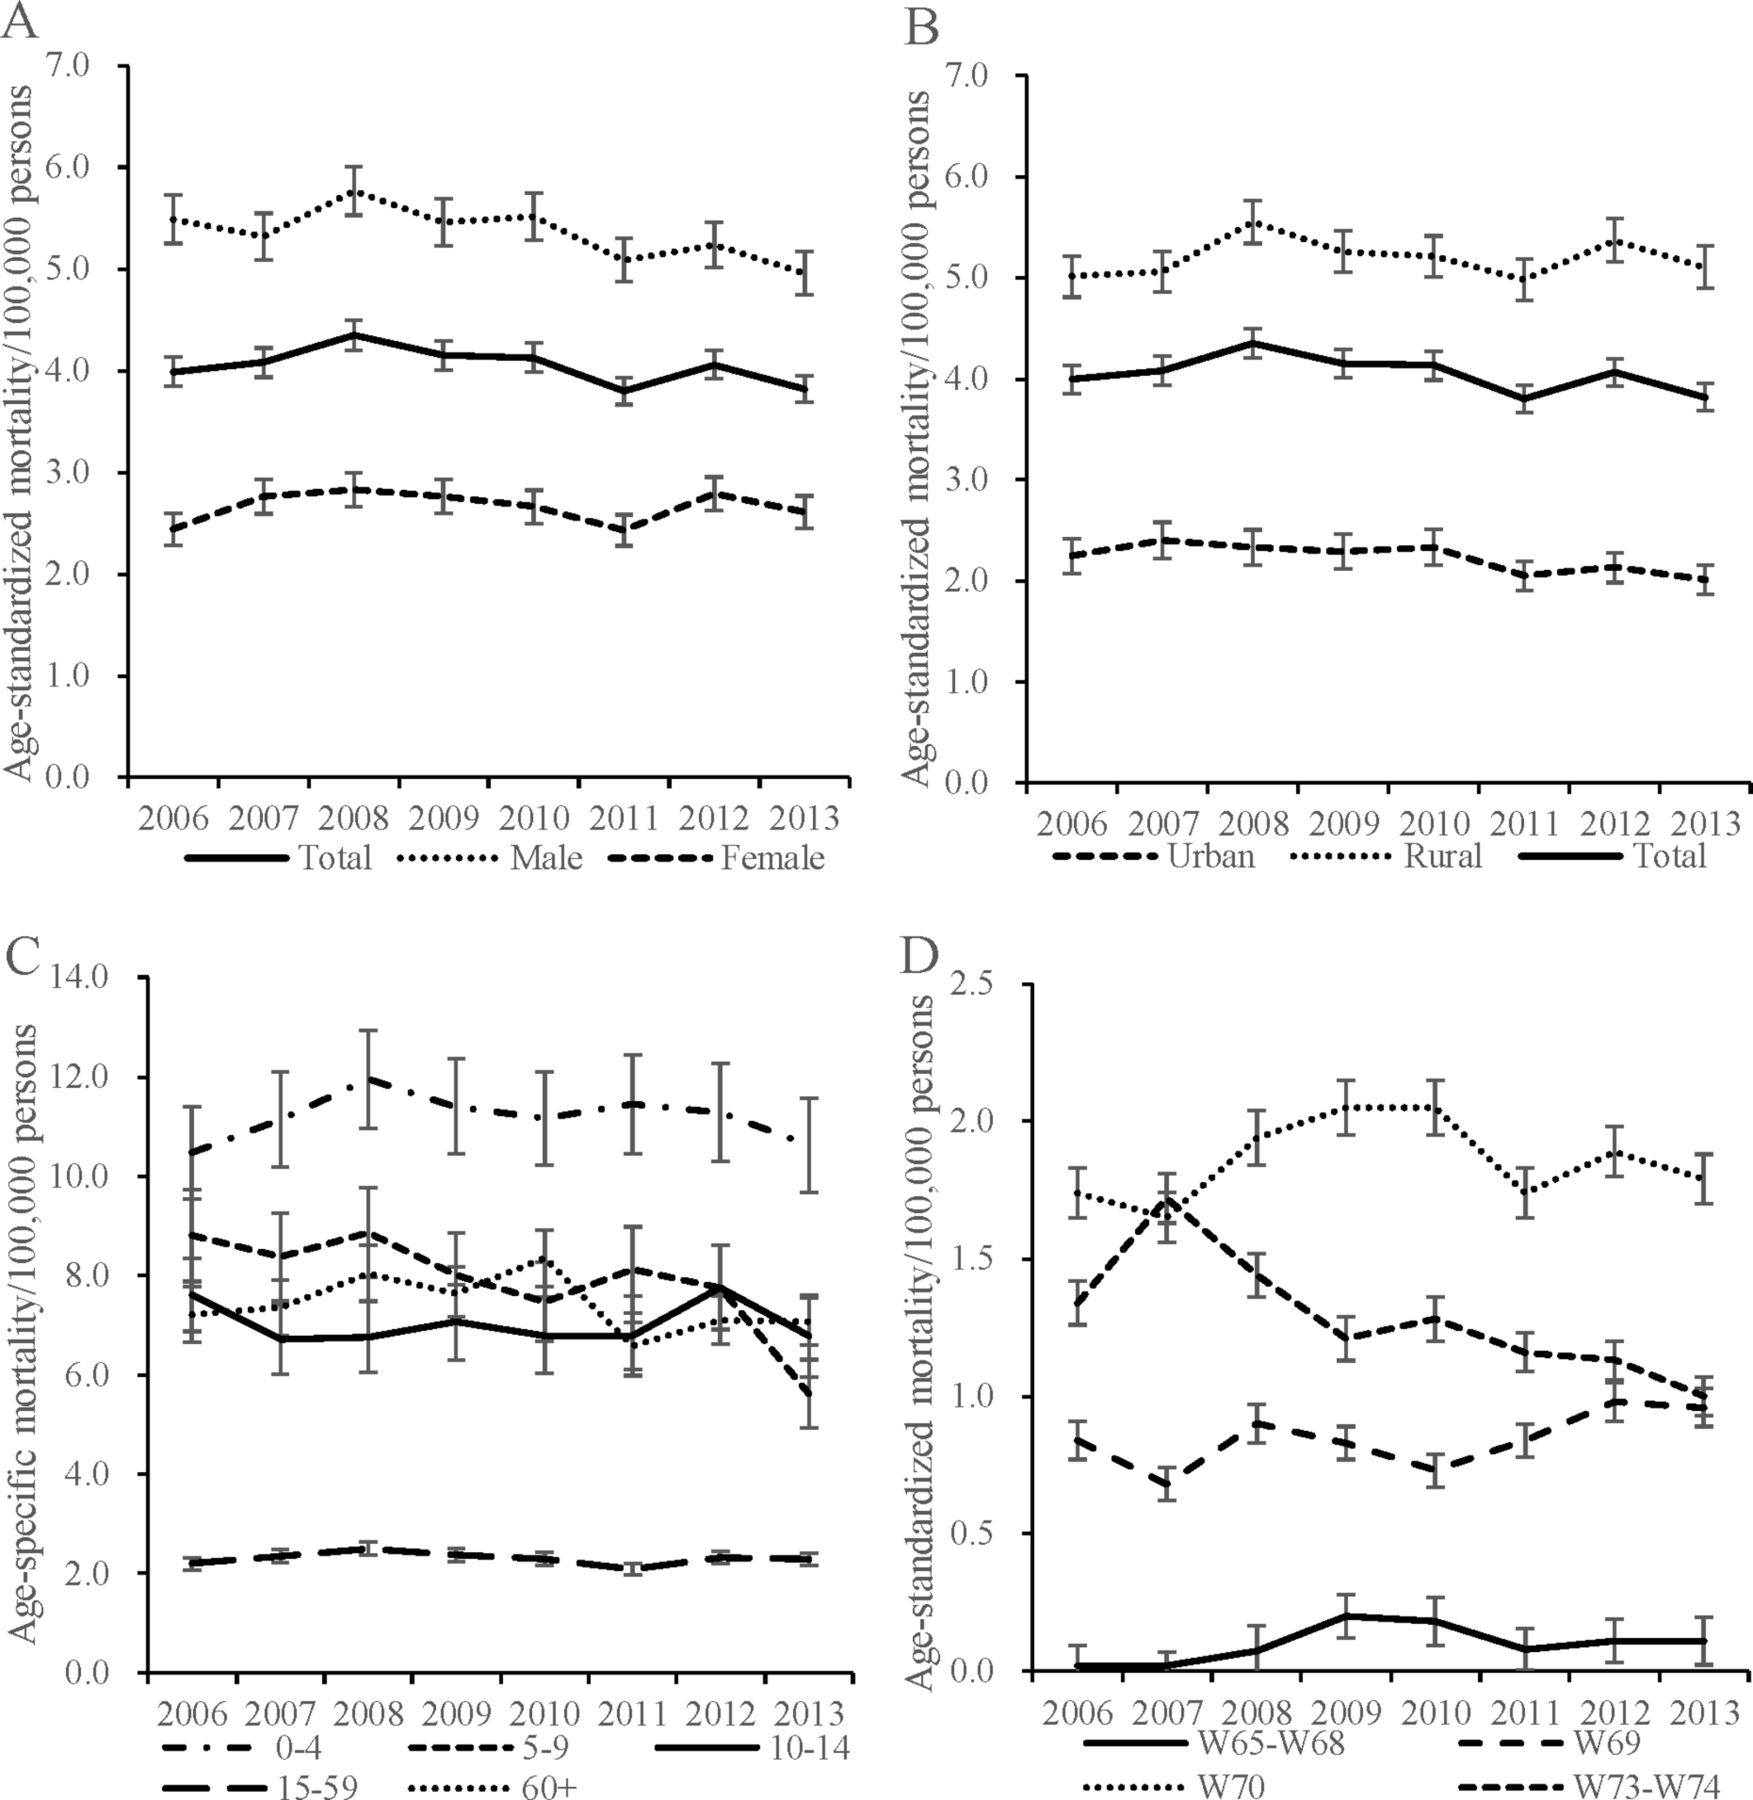
From 2006 to 2013, a total of 25 619 drowning deaths were reported in China by the DSPs. Overall drowning mortality remained relatively stable between 2006 and 2013, ranging from 3.80 to 4.35 per 100 000 population (table 1 and figure 1). The crude mortality was 3.82 per 100 000 persons in 2013 (95% CI 3.69 to 3.95). Univariate analysis showed that men and rural residents consistently had much higher drowning mortality rates than women (mortality rate ratio 2.1, 95% CI 1.9 to 2.3) and urban residents (mortality rate ratio 2.4, 95% CI 2.2 to 2.6) across the study time period.

Mortality rates from drowning in China between 2006 and 2013 for different population subgroups. (A) Total, male and female mortality; (B) total, urban and rural mortality; (C) mortality for five different age groups; (D) mortality across four different causes of death. Note: (1) W65–W68, drowning in bathtubs and swimming pools; W69, drowning in natural water; W70, drowning following fall into natural water; W73–W74, other specified and unspecified drowning. (2) Bars around the lines signify 95% CI of drowning mortality rate. (3) Mortality rates from drowning in bathtubs and swimming pools (W65–W68) were unstable for most years due to small numerator of less than 20 deaths.
Drowning mortality per 100 000 persons in China, 2006–2013
Within subgroups of the population, the drowning mortality rate did not change significantly between 2006 and 2013 for either men or women. Urban drowning mortality decreased by −15% (95% CI −28% to −3%) between 2006 and 2013, but the rate for rural residents did not change significantly. Among the five age groups, the under-5 age group consistently had the highest drowning mortality between 2006 and 2013 (ranging from 10.47 to 11.95 per 100 000 persons), while the age group 15–59 years consistently had the lowest drowning mortality (ranging from 2.09 to 2.50 per 100 000 persons). Only the age group 5–9 years showed a significant decrease in drowning mortality between 2006 and 2013 (−57%, 95% CI −84% to −33%).
Of the four mechanisms we considered, drowning following a fall into natural water was most common (W70; 46% of drowning deaths in China from 2006 to 2013), followed by other specified and unspecified drowning (W73–W74; 32%), drowning in natural water (W69; 21%) and drowning in bathtubs and swimming pools (W65–W68; 1%). The mortality from other specified and unspecified drowning demonstrated a −33% decrease between 2006 and 2013 (95% CI −46% to −22%).
Discussion
Our results offer four primary findings: (1) the overall drowning mortality rate in China remained relatively stable between 2006 and 2013; (2) men, rural residents and children under the age of 5 consistently had higher drowning mortality rates than women, urban residents and other age groups; (3) except for distinct decreases in urban residents, children aged 5–9 years, and other specified and unspecified drowning (W73–W74), all other subgroup drowning mortality rates did not change significantly between 2006 and 2013; and (4) drowning following a fall into natural water (W70) was the most common mechanism in China, comprising 46% of all drowning deaths.
The overall crude mortality ranged from 3.75 to 4.36 per 100 000 persons from 2006 to 2013, which was lower than the estimate from the Global Burden of Disease (GBD) 2016 update over the same time period (from 5.10 to 6.84).15 The difference is probably due to the fact that the GBD study group adopts multiple sources of mortality data for China and then adjusts data by reallocating ‘garbage codes’ that reflect inaccurate or ambiguous data.16 17 Similar injury mortality differences are reported between GBD and national estimates in the USA.18
Compared with overall 2013 drowning mortality rates of 21 countries reported by Wu et al based on the WHO mortality dataset,19 the drowning rates we report from China are higher than most countries, although they are lower than two other middle-income Asian nations, the Philippines (4.03 per 100 000 persons) and Thailand (6.14 per 100 000 persons). Among young children, the under-5 drowning mortality we reported ranged from 10.47 to 11.95 in China between 2006 and 2013, which is higher than most countries from 2006 to 2011 but slightly lower than that in other middle-income countries such as Thailand (2004–2006) and Kyrgyzstan (2008–2010).20
Drowning mechanisms we report from China can also be compared with results from other nations around the world. Natural water was the primary location for fatal drowning deaths in China (67% of drowning deaths), results that parallel most other countries.20 Especially risky in China were drowning deaths following a fall into natural water, which comprised 46% of all fatal drowning deaths. These results concord with reports from three local studies in China3 7 8 but differ somewhat from reports in several developed countries. For example, similar to our report in China, natural waterways, in particular rivers, creeks and streams,21 22 are the leading locations for drowning in Australia. For Australian children under age 19 in Queensland, however, pools and baths are the leading drowning locations.23 Similarly, swimming pools are cited as the most common place for drowning in the USA24 and drowning deaths in bathtubs are the most common mechanism for drowning fatalities in Japan.25 Cultural and environmental differences likely explain the disparities across countries. In China, public swimming pools are scarce and natural bodies of water are common in many regions of the country,3 so recreational swimming and unintentional falls occur most often in natural bodies of water, especially in rural areas. Further, swimming lessons are comparatively uncommon in China and most natural bodies of water have no physical barriers around them.26 In contrast, children learn to swim in most high-income countries, swimming pools are much more common in Australia and the USA than in China,23 24 and Japanese households often keep water in bathtubs for several days at a time,27 increasing exposure and opportunity for drowning in those locations and countries.
Our results also parallel those from previous publications examining particular regions or cities in China.3–5 Subgroup analysis by gender, age and location confirm that men, rural residents and young children are at high risk of fatal drowning compared with women, urban residents and other age groups. Previous studies suggest the high risk of drowning for these populations may be related to several factors, including (1) better swimming ability (and in some cases perception of better swimming ability that leads to risk-taking) among men compared with women7; (2) greater exposure to water, including swimming alone and swimming in more dangerous natural bodies of water, among men compared with women and among rural residents compared with urban ones7; (3) poor access to health facilities and scarcity of public swimming pools, which leads people, especially boys and young men and those living in rural areas, to swim in more dangerous natural waters in summer3; and (4) children’s developmental limitations to recognise danger and escape from risky situations in or near water.26
Our findings have policy implications. First, the simple fact that so many deaths are occurring in China—over 52 000 deaths when China’s 2013 population is applied28—and that the death rate remained essentially unchanged from 2006 to 2013 underlines the importance and urgency of national drowning prevention efforts. There are documented prevention strategies used elsewhere in the world that might be applied to China, such as removing or covering water hazards, teaching school-age children basic and/or survival swimming and resuscitation skills, encouraging use of personal flotation devices and providing safe places with lifeguards or other qualified adults present to supervise swimmers.26 Unfortunately, drowning prevention in China has been underemphasised and underfunded compared with other injuries like road traffic crashes and non-injury diseases (including infectious diseases and non-communicable chronic diseases), mainly because no single government agency has been established or assigned to lead drowning prevention efforts in China.29 30
A second policy implication is that certain subpopulations have particular risks, including men, rural residents and young children under the age of 5. Policy efforts might focus on those at-risk populations through strategies that target areas of greatest risk and prevention potential. Effective strategies26 that are recommended by WHO (as listed above) might be introduced to China and culturally tailored for dissemination. According to WHO guidelines, these functions could be implemented by health departments.31
Our study was limited by several factors. First, the introduction of a web-based reporting system for the DSPs in 2008 may have caused some fluctuation in drowning mortality rates because the change of reporting methods created potential bias to drowning reporting compared with prior years.12 Second, we were only able to include variables collected by the DSPs and therefore omitted potentially valuable information on drowning risks, including dangerous behaviours, adult supervision of children and the implementation of recommended interventions (such as fencing around ponds near rural homes).26 Future research should collect such information to clarify the picture of drowning mortality changes over time and subpopulation differences. Third, we cannot evaluate the impact of provincial variations in reporting unspecific drowning on the estimation of national drowning mortality due to lack of detailed data. Recent publications showed large variations in reporting unspecific drowning across countries.19 32 Last, drowning mortality reported in this study is based on the underlying cause of death and W65–W74 ICD codes only. Peden et al 33 report that additional codes (T75.1, V90, V92, X38 and Y21) are also unintentional drowning codes and, when not included, may significantly under-report drowning estimates.
Conclusions
We conclude that drowning presents a serious public health threat in China and the scope of the problem has been unchanged since 2006. The Chinese government should urgently consider policy to overcome the obstacles to drowning prevention and enhance support for injury control at strategic and practical levels.
What is already known on the subject
Drowning is a serious public health problem in China.
Epidemiological characteristics of drowning are reported in selected provinces and cities for China but not nationwide.
What this study adds
Age-standardised drowning mortality in China remained relatively stable from 2006 to 2013.
Drowning following a fall into natural water was the most common mechanism, accounting for 46% of fatal drowning deaths in China from 2006 to 2013.
References
Footnotes
LW and XC are joint first authors.
Contributors All authors contributed to the following: conception and design, acquisition of data or analysis and interpretation of data; drafting the article or revising it critically for important intellectual content; final approval of the version published.
Funding The authors have not declared a specific grant for this research from any funding agency in the public, commercial or not-for-profit sectors.
Competing interests None declared.
Patient consent Not required.
Provenance and peer review Not commissioned; externally peer reviewed.