Article Text

Abstract
Background While survey data are available for national estimates of fire events and firefighter fatalities, data on firefighter injury at the national and local levels remain incomplete and unreliable. Data linkage provides a vehicle to maximise case detection and deepen injury description for the US fire service.
Methods By linking departmental Human Resources records, despatch data, workers' compensation and first reports of injury, researchers were able to describe reported non-fatal injuries to 3063 uniformed members of the Philadelphia Fire Department (PFD), for the period of 2005 through 2013.
Results Among all four databases, the overall linkage rate was 56%. Among three of the four databases, the linkage rate was 88%. Because there was duplication of some variables among the datasets, we were able to deeply describe all the linked injuries in the master database. 45.5% of uniformed PFD members reported at least one injury during the study period. Strains, falls, burns and struck-by injuries were the most common causes. Burns resulted in the highest lost time claim payout, and strains accounted for the highest medical claim cost. More than 70% of injuries occurred in the first 15 years of experience.
Discussion Data linkage provided three new benefits: (1) creation of a new variable—years of experience, (2) reduction of misclassification bias when determining cause of injury, leading to more accurate estimates of cost and (3) visualisation of injury rates when controlling for the number of fire department responses, allowing for the generation of hypotheses to investigate injury hot spots.
This is an Open Access article distributed in accordance with the Creative Commons Attribution Non Commercial (CC BY-NC 4.0) license, which permits others to distribute, remix, adapt, build upon this work non-commercially, and license their derivative works on different terms, provided the original work is properly cited and the use is non-commercial. See: http://creativecommons.org/licenses/by-nc/4.0/
Statistics from Altmetric.com
Introduction
Even though it is a known high-risk occupation, there exists no injury surveillance system for the US fire service. While survey data are available for national estimates of fire events and firefighter fatalities, data on firefighter injury at the national and local levels remain incomplete and unreliable.1–3 Existing survey-based efforts lack rigorous scientific design, produce widely ranging estimates, and lack important information regarding the cause, nature and context of injury. Therefore, resulting data are not generalisable, reliable or reproducible, and cannot serve as a basis for devising safety policies or evaluating the benefit of safety interventions.
While there have been revealing descriptions of firefighter injuries in select fire departments, a department-level solution for firefighter injury surveillance has not been proposed for widespread application.4 ,5 Experts have recommended that data linkage, similar to what is done in the Crash Outcome Data Evaluation System (CODES), would be beneficial for the fire service.3 CODES links data from diverse sources including police crash reports, emergency departments and hospital discharges. The Federal Emergency Management Agency's (FEMA) Assistance to Firefighter Grants program, the primary funder of firefighter safety and health research, recognised the above deficiencies and included database systems in the eligible activities for research and development projects. Data linkage provides a vehicle to maximise case detection and deepen injury description for the US fire service.
Two FEMA-funded studies investigated the minimum data elements necessary to create injury surveillance systems for the US fire service: Firefighter Injury Research & Safety Trends (FIRST) and FIRST-Reliability Study. Based on the review of the literature and input from an advisory board of fire service professionals, a data-driven approach was successful in linking previously unrelated data systems.6 Linkage pilots were conducted at state and fire department levels. The fire department linkage pilot which allowed for the analysis of non-fatal injuries in the Philadelphia Fire Department (PFD) is described herein.
The PFD is a large metropolitan fire department employing more than 2000 firefighters and paramedics. The firefighters are trained in basic Emergency Medical Services (EMS) response services, while the paramedics have gone through more advanced, rigorous EMS response training. According to a local union trustee, the sole EMS providers work 12 hour shifts on a ‘3 days on/2 days off’ followed by ‘2 days on/3 days off’ schedule, while firefighters are on 12 hour shifts on a ‘4 days on/4 days off’ schedule. Firefighters respond to medical calls in addition to fire and other emergency calls, while paramedics run medical response only. The department responds to around half a million calls per year, providing services to the 1.5 million residents of Philadelphia.
Methods
The PFD master database was constructed by linking datasets through deterministic, probabilistic and direct visual linkage. The data sources included Human Resources (HR) records from PFD, first report of injury (FRoI) from the Safety Office, workers' compensation claims from the City of Philadelphia Office of Risk Management and despatch records from the Fire Communications Center.
Data sharing agreements were completed between Drexel University, the PFD and the city's Risk Management Department. The protocol was approved by Drexel's Institutional Review Board and FEMA's Office of Research Compliance.
Data sources
Data were collected for injuries reported from 1 January 2005 through 31 December 2013. When an injury occurred, the injured employee's company officer obtained an injury number from the Fire Communications Center. The Fire Communications Center operates a computer-aided despatch (CAD) system that logs all calls to 911 for fire and EMS services. The CAD data contains incident number, address of response and incident information (eg, equipment despatched, time stamps of arrival, call type), but does not contain information on an injured employee. In a separate, non-computerised paper log, the Fire Communications Center documented the employee's payroll number, where the injury occurred, a brief description of the injury, assigned a unique injury identifier (the injury number) and a unique identifier if the employee was on a response (the incident number). This initial documentation was then sent to PFD's offices of HR and the Safety Office for additional documentation. HR captured demographic information, date of hire/termination, current rank, reported injuries and active duty status. HR tracked injuries in a separate system from the Safety Office (Human Resources Injury database, HRI); so, HRI data served as an internal check to ensure all reported injuries were included in the final dataset. The Safety Office recorded FRoI and the City of Philadelphia Accident, Injury and Illness (COPA II) report data. The FRoI is an internal PFD-developed form that captured the date, nature, anatomical location of injury and the unique identifier for the firefighter (payroll number). The COPA II is a form used for all city employees that captured data on cause and location of injury on the body. If a reported injury resulted in a disability claim, the injured had 120 days to report the incident to the City of Philadelphia's Office of Risk Management through its third party carrier, Compensation Services Incorporated. (CSI). Data captured by CSI included cause and nature of the injury, description of the events leading to the injury and cost data on medical treatment and partial salary compensation.
Data linkage
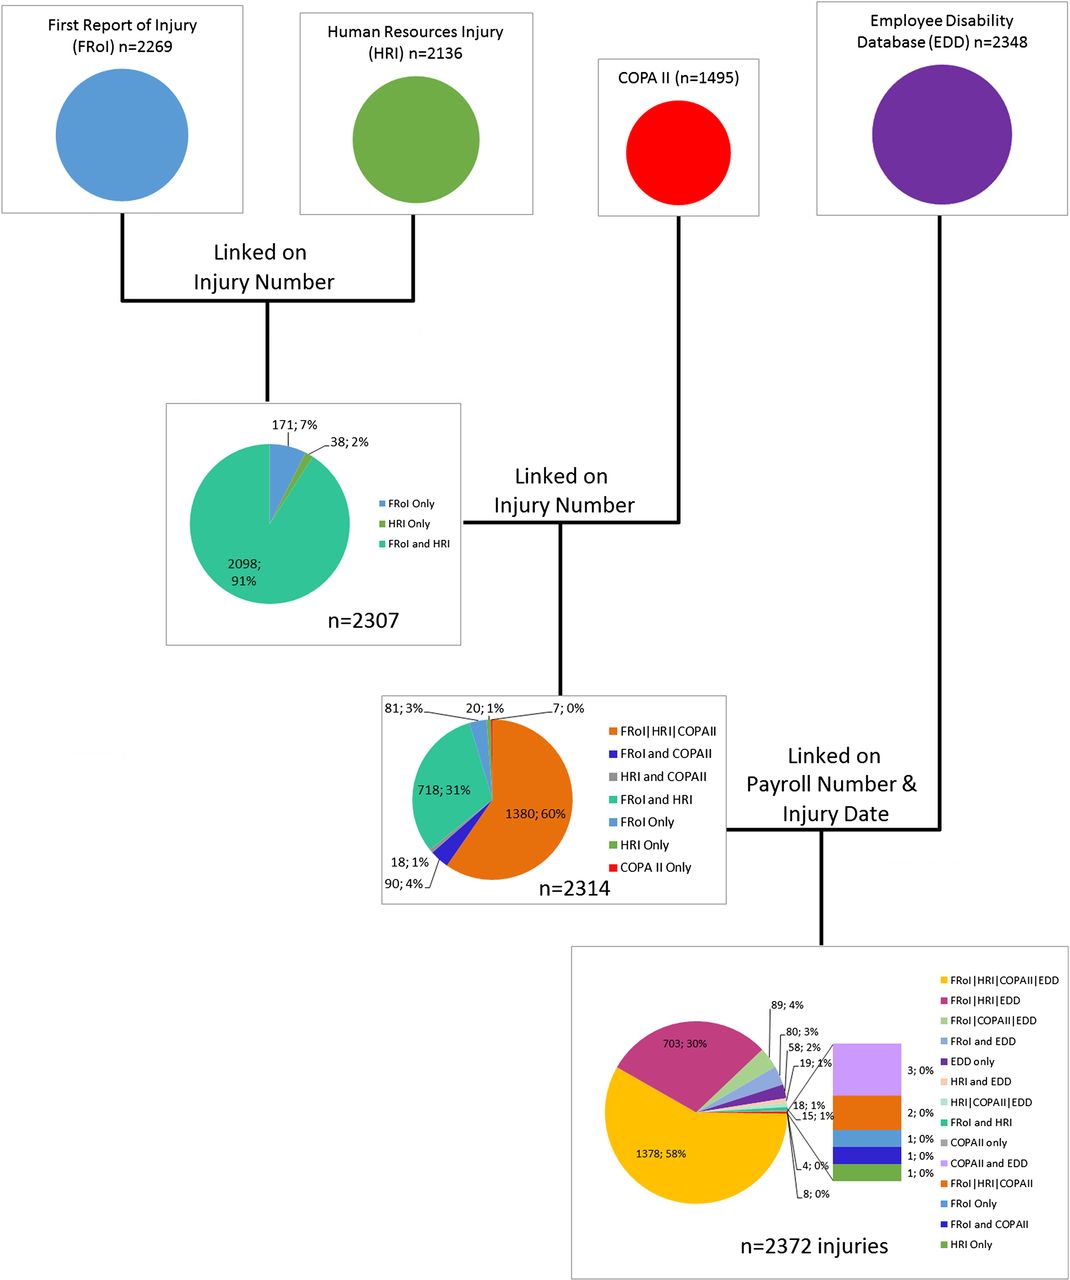
Datasets were linked together sequentially. The first two linked datasets were the FRoI and the HRI datasets. This was then matched to the COPA II dataset and then to the Employee Disability Database (EDD). Finally, the injury dataset was matched to the HR. Each of these linkages first linked on the basis of deterministic matching, then probabilistic record matching, and finally, direct visual matching. Deterministic matching variables included payroll number, injury number (a sequential, unique identifier used in the FRoI and HRI databases) and injury date. In order to conduct probabilistic record matching, injury date was modified to include 5 days before and 5 days after the recorded date. Figure 1 displays the composition of the final injury dataset.

Summary of data linkage process.
Variables
Demographic variables including age, sex, race, rank, years of experience (YOE) and occupation came from the HR dataset. We created two YOE variables: YOE at time of injury and total YOE throughout the study period. YOE at time of injury was calculated by subtracting date of hire from injury date. The total YOE in each of the 9 years of the study period was calculated as the difference between date of hire and December 31 of each year, or the difference between date of hire and termination date if termination occurred in the year of interest (2005 through 2013). We calculated the injury rate controlling for YOE using the following formula:
Cause and nature of the reported injury were based on the Workers' Compensation Insurance Organizations (WCIO) rubric for workers' compensation injury and determined from inspection of the cause and nature variables from EDD, FRoI and COPA II.7 Light duty was determined from the HRI dataset if a date of light active duty was recorded, while lost time was determined by whether or not the injury resulted in paid compensation from the EDD. We also determined whether or not the reported injury occurred responding to an incident from the existence of an incident number on the FRoI, HRI or COPA II datasets. However, not all reported injuries that occurred while responding to an incident had an associated incident number, nor did all injuries that did not occur while responding to an incident lack an incident number. It has been confirmed that, in some instances, a reported injury that occurs at the firehouse or in training may result in the generation of an incident number by the despatch office. Incident numbers were present in the despatch data, as well as geographical location of response.
Assessing cause of injury misclassification
Each dataset had an associated narrative describing the injury. Through these we discovered that many of the injuries were not correctly categorised. In order to correctly classify cause and nature of injury, SAW and JAT conducted an expert review to appropriately recode injuries into WCIO categories.7 We calculated cost by mechanism of injury before and after expert recoding.
Mapping of firefighter injuries
Firefighter injuries were linked to the despatch data through the incident number. ArcGIS was used to map the number of firefighter injuries by call volume at the 2010 census tract level for the City of Philadelphia. Only 1 year of data (2011) were evaluated, because latitude and longitude have only recently been added to the Fire Communication Center (FCC) despatch system.
Statistical analysis
We used descriptive statistics to assess the distribution of all continuous (mean/median/range) and categorical variables (counts/percentages). We previously discovered significant differences in some injury causes by fire service occupation; thus, we delineated injuries among uniformed personnel by firefighters or paramedics.8 We used the χ2 test or Fisher's exact test, depending on cell counts. Continuous variables were compared with categorical variables using t-tests. We examined statistical significance between injured and non-injured, and between firefighters and paramedics. Statistical significance was set to 0.05 for all analyses. Data management, linkage and analysis were all conducted using SAS V.9.3. Despatch data were analysed using ArcMap 10.3.1.
Results
Data linkage
For the final injury database (figure 1), the Safety Office provided data (n=2269 records) on FRoI. HR provided information on 2136 injuries. The Office of Risk Management provided employee disability claims data (n=2348 records) and data from the COPA II reports (n=1495 records). The COPA II form was inconsistently filed (more than one-third of reported injuries lacked an associated COPA II form).
After linkage, 2372 injuries were retained in the final dataset. Of these injuries, 95%were present in the FRoI source, 76% were present in the HRI data source, 46% were present in the COPA II data source and 98% were present in the EDD. Fifty eight per cent of the 2372 injuries linked across all four data sources. An additional 30% linked among FRoI, HRI and EDD, amounting to 88% of all injuries being accounted for in at least three of the four data sources. The remaining 12% of injuries were found in at least one of the data sources.
Demographics of injured PFD uniformed employees
Among all uniformed employees, 1395 (45.5%) reported at least one injury during the study period (table 1). We observed differences in injury by race (p<0.001), with black and Hispanic employees slightly more likely to have reported an injury than not, when compared with white employees. Injured employees were also younger and less experienced. There was no difference in the proportion of reported injuries by rank (p=0.316). Of the 194 females in the uniformed PFD population, 66.0% reported experiencing at least one injury, while 44.2% of males reported experiencing at least one injury (p<0.001). Of the 2697 firefighters, 43.7% reported an injury, while 59.3% of paramedics (n=217 of 366) reported at least one injury in the same time period (p<0.001).
Descriptive statistics of all uniformed members of the PFD from 2005 to 2013 comparing those who had any reported injury with those who did not
Cause and nature of injury to firefighters and paramedics
Of the 1395 (45.5%) ever-injured firefighters and paramedics described in table 1, there were 2372 injuries reported between the years 2005 and 2013. Therefore, 41.2% (n=977) of reported injuries were repeat injuries to the same person over the 9-year period.
Table 2 describes these injuries. One-third (33.5%) were single injuries experienced by an employee throughout the study period, while the remaining 66.5% of injuries were multiple or repeat injuries to the same employee. Approximately 81% of injuries were to firefighters, 19% to paramedics; firefighters accounted for 88% of the total population, and paramedics 12%. There were 1916 reported injuries to firefighters, 95.0% of which occurred in male firefighters and 5.0% in females. Of the 456 reported injuries to paramedics, 57.5% were to males and 42.5% to females.
Descriptive statistics of all injuries reported from 2005 to 2013, comparing PFD firefighters with paramedics
The overall leading causes of injury were strains, falls, burns and struck-by injuries. In firefighters, the two leading causes of injury were strains and burns (24.9% and 19.8%, respectively). For paramedics, strains (36.8%) and struck-by injuries (19.7%) were the leading causes of injury. Struck-by injuries (19.7%) were more numerous in paramedics than in firefighters (11.0%). Burns accounted for 16.1% of all injury causes, with only 2 (0.4%) of these injuries occurring to paramedics.
In both firefighters and paramedics, strains (19.8% and 37.5%, respectively) and contusions (17.5% and 22.1%, respectively) were the leading nature of injury, while burns and sprains made up the third leading nature of injury for firefighters and paramedics, respectively (15.4% and 13.8%). Paramedics had a statistically significant lower number of YOE at the time of injury than firefighters (8.5, 11.91 years; p<0.001).
Benefits of data linkage
The following three sections are each an exemplar demonstrating the benefits of data linkage.
Development of a new variable: YOE
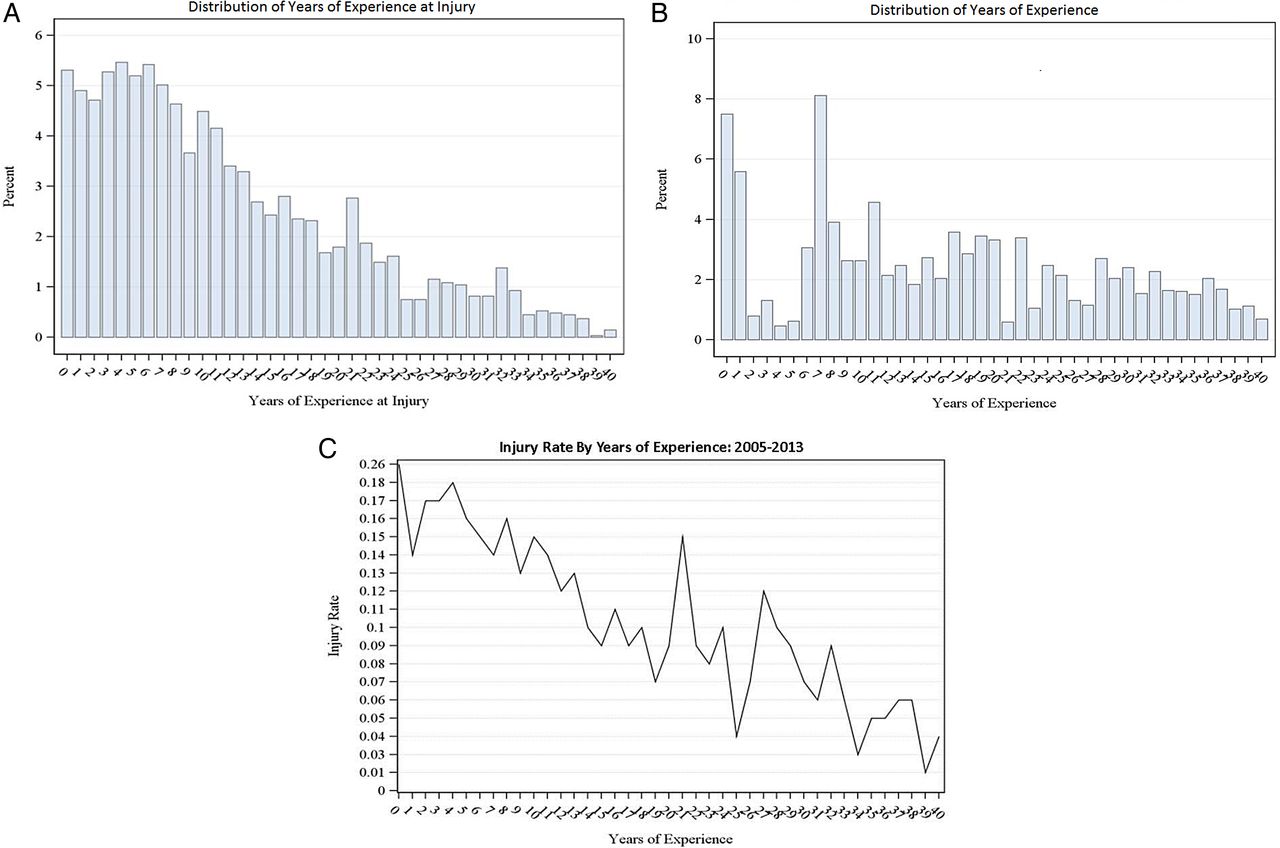
We investigated the contribution of YOE to injury risk. Figure 2 shows a series of panels culminating in the injury rate controlling for YOE at the time of injury and the total number of YOE throughout the study period. The numerator for the injury rate is the sum of individuals who experienced an injury at each year of experience. The denominator is the sum of individuals who had those YOE. Due to the change in YOE for each employee throughout the time of the study (9 years of potential accrual of additional YOE), this is how we controlled for the employees' changing tenure throughout the study period. The injury rate for PFD uniformed employees declines as YOE increases, as shown in figure 2C. In the first 15 YOE, 70.1% of injuries occurred (figure 2A). Fifty per cent of the population had 15 YOE or fewer (figure 2B), and 50.0% of those individuals with 15 YOE or fewer reported experiencing at least one injury over the course of the study period.

Years of Experience at Injury (A), Years of Experience (B), and Injury Rate by Years of Experience (C), for Philadelphia Fire Department 2005–2013.
Correction of misclassification bias: cost of injury
Table 3 presents the workers' compensation costs (lost time salary compensation and medical treatment) for injuries both before and after expert injury recoding. The most prevalent and costly causes of injury before and after expert recoding were strains, falls and burns. However, after recoding, the total costs of burn and strain injuries increased by US$750 000 and US$1,000,000, respectively. Moreover, approximately 30% of the injuries that had been initially categorised as ‘miscellaneous causes’ were recoded into more specific cause categories, effectively redistributing US$770 000 of all claim costs.
Cost of injuries before and after expert recoding, by cause of injury: PFD 2005–2013
Burns were the most expensive lost time claim (36.4%, US$4 782 848) before and after expert recoding, with 11 recoded injuries resulting in US$551 681 of additional costs. Injuries due to strain resulted in the highest medical claim costs (37.8% or US$4 084 208).
Visualisation of data: mapping of firefighter injuries during responses
Injuries linked to despatch data through the incident number yielded a latitude and longitude for the place of injury. Figure 3 shows by Philadelphia census tract: the distribution of calls (figure 3A), the distribution of injuries (figure 3B) and the distribution of injuries by call volume (figure 3C) for 2011. The pattern of despatch calls varies across the city, where clusters of census tracts display elevated numbers of calls. In looking at the number of injuries, we find that many census tracts display only one injury; however, a few tracts along the north-east border and south-west border show as many as 10 and 5 injuries, respectively. When looking at the number of injuries relative to the number of calls in a given census tract, there is a significant amount of variability across the entire city.

Mapping of firefighter injuries during responses in Philadelphia.
Discussion
Data linkage for firefighter injury surveillance provided three new benefits. The first was the creation of a new variable that sheds light on potential risk factors for firefighter injury: YOE. Our analysis showed that 70% of firefighter injury occurred during the first 15 years of a firefighter's tenure. The second benefit was the reduction of misclassification bias when determining cause of injury. The reduction of misclassification led to more accurate estimates of costs, sometimes resulting in up to US$1 000 000 differences. The third benefit of data linkage was visualisation of injury rates when controlling for the number of fire department responses. Such visualisation allows for the generation of hypotheses to investigate injury hot spots through future investigations.
Creating a robust data system through linkage of fire department HR, workers' compensation, FRoI and despatch data offers a unique opportunity for the surveillance of reported firefighter injuries. Access to longitudinal HR data affords more extensive occupational history information including tenure, promotion or transfer between stations. However, the HR department did not have complete historical occupational records for employees. There were incomplete years, years of promotion and terms of promotion, particularly for those who had been separated from the department (ie, retirement), or who were not active employees at the time of data acquisition. Access to denominator data from despatch made it possible to study reported injuries based on exposure (ie, type of response, numbers of calls per year).
Among all four databases, the overall linkage rate was 56%. Among three of the four databases, the linkage rate was 88%. We were quite satisfied with the latter and believe that, had we received complete COPA II records for each injury, the overall hit rate among the four databases would have approximated 88% as well. Fortunately, many variables we needed from COPA II were also present in the EDD; so, we were able to deeply describe all the linked injuries in the master database. This was because we had unique identifiers (eg, employee ID, incident number) on which to conduct sequential linkage. While many linkage variables are sensitive and personally identifiable, it is imperative that public health surveillance retains access to them in order to maximise data utility. By linking data through the use of unique identifiers (eg, employee ID number, injury number and incident number), we were able to find reported injuries that were not present in all datasets. While one of the expectations of data linkage is to increase case detection, we maximised our overall case finding by only about 5%. This was a welcomed surprise in that the FRoI and EDD data collection processes documented an injury when it occurred. However, both of these data sources lacked detail on the circumstances surrounding the injury (FRoI), and had significant misclassification bias (EDD). It was only through the linkage of these four data sources that we were able to see how incorrect a lot of the workers' compensation coding for cause was. Because each database had narrative text, linkage enabled us to reconcile divergent injury cause classifications through expert opinion into the correct WCIO category. The results of expert recoding of data to minimise misclassification bias (table 3) point out concerning problems with the coding of firefighter injuries using the WCIO rubric. For example, if we had used the original cause categories coded by CSI, we would have underestimated by approximately US$1 million the impact of strain injuries and would have underestimated US$765 000 for burn injuries (table 3). Seventy-five per cent of each of these costs is salary charges due to lost time from work. This is expensive for municipalities because they must either pay overtime or hire temporary workers to make up for the lost employees' contribution. Similarly, we would have overestimated the cost of struck-by injuries, putting emphasis where it was not most useful. Since we were able to clarify these data, our goal of deeply and accurately describing injury through data linkage was accomplished, and we could release the results of our analysis to the fire department with confidence.
Workers' compensation data are critical for the evaluation of firefighter injuries because they capture information on the workplace, the type of occupation, the nature and mechanism of injury, and the cost of medical treatment. However, the literature criticises it for not using the standardised international classification systems (ie, International Classification of Diseases (ICD), Bureau of Labor Statistics-Standard Occupational Classification (BLS-SOC)) that confer precision in injury estimates.9
In our study, we found that the third party administrator for workers' compensation did not have a rubric they follow when categorising injuries by cause and nature. Employees did not have formal training or guides to ensure consistency in categorising similar injuries.
If workers' compensation data are used to present injury prevention priorities for fire departments, our findings suggest that the results are highly imprecise. Such uncertainty could direct fire departments to prioritise intervention on the wrong injury or underestimate costs savings for any prevention interventions they initiate. This is of serious concern for the fire service, as departments must often seek external funding or negotiate municipal budgets in order to get prevention resources.
The relationship between struck-by injuries and occupation (19.7% of injuries to paramedics and 11.0% of injuries to firefighters) has been previously reported by our group. The findings showed that paramedics were more likely than firefighters to experience an injury due to patient-initiated violence (OR 14.4, 95% CI 9.2 to 22.2).8 In the present study, we continued to parse injury results by occupation, because we believe there remain important differences in hazards between firefighters and paramedics. For example, 59% of paramedics reported at least one injury throughout the study period, compared with 44% of firefighters (data not shown).
Two variables that were a direct product of linkage, and contributed to the understanding of injury to the uniformed members of the PFD, were the cost of injury variable and the YOE variable.
The YOE variable allows us to look at injuries that take place at different times throughout a firefighter's career. With this new variable, born of linkage between FRoI, HR and workers’ compensation data, we found that over 70% of injuries occurred within the first 15 years of a firefighter's tenure. We observed a negative correlation between rate of reported injury and YOE.
By linking workers' compensation claims to FRoI and HR records, we were able to investigate both the medical and lost time claims associated with injuries during the time of study. The linked data will enable PFD to further investigate reported injuries on the basis of the most numerous and the most costly injuries. Though strains resulted in the highest total cost, burns resulted in the highest total lost time cost at over 1.5 times as much as its closest neighbour, strains. With the additional narrative data acquired through linkage, administrators can consider contributing factors, trends and prevention strategies to minimise injury and reduce cost of injury for the department.
Lost time claims comprised 26.2% of workers' compensation injuries. This is similar to the 30% lost time from work between 2004 and 2009 reported by Poplin for Tucson Fire Department.4 However, in contrast, we found lost time claims for burns (46.6%) and strains/sprains (27.6%) to be different from the Tucson findings of 19.2% and 34.7%, respectively.4 Strains and sprains were the most common cause of injury (67.1%) in Tucson firefighters between 2004 and 2009, with 34.7% of them resulting in lost time.5 Our analysis shows that strains were the most frequent cause of injury, resulting in a lost time claim (n=173). Similar to Tucson, 27.6% of all strain injuries resulted in a lost time workers' compensation claim. At 28.7%, burns were the second most frequent cause of injury (n=172), resulting in a lost time claim in the PFD. This is in contrast to Tucson, where only 5 of the 26 total burn injuries resulted in a lost time claim.5 These differences may exist for numerous reasons, including variation in reporting, built environment, gear type used and operating procedures.
There are limitations to this type of surveillance and its implementation nationally. The main limitation is that there are approximately 30 000 fire departments in the USA. Without specific resources, it would be a challenge to implement in every fire department. The methods described herein can be used by researchers wishing to assist fire departments. We use our FEMA funding to support fire departments to build these data systems, but institutionalisation of such efforts needs funding commitment.
The other limitation is that the fire service has not had the luxury of prioritising data and training on its utility. Fire departments often use untrained employees on light duty to enter data and maintain databases. Furthermore, there are no standards for reporting injuries at the fire department level. While accurate and complete databases are necessary to promote positive outcomes such as the acquisition of resources on the basis of proof of need, standards are necessary to allow comparison of fire departments. Understanding the utility of data will enable the fire service and its research partners to reliably investigate injuries in order to develop prevention strategies.
What is already known on the subject?
Firefighting is a dangerous occupation. 50% of firefighter deaths are a result of injury.
Approximately 60% of firefighter injuries happen outside of the fireground.
One-third of firefighter injuries occur during training.
What this study adds?
Data linkage using unique identifiers to unite multiple data sources enables deeper description of firefighter injury.
Data linkage allows for the creation of a new potential injury predictor: years of experience.
Data linkage reduces misclassification bias when determining cause of injury, thus producing more accurate estimates of costs.
Data linkage allows for the visualisation of injury rates when controlling for the number of fire department responses.
Acknowledgments
The authors thank the Philadelphia Fire Department, the International Association of Fire Fighters Local 22 and the City of Philadelphia's Office of Risk Management for their partnership in this study. They also thank Cydney McGuire for her assistance in construction of data tables, TJ Risoli for his assistance with data analysis, and Genevieve Adair and Steve Melly for their contribution to the despatch data GIS analysis. The authors especially wish to thank the input of three anonymous reviewers, whose interest in this study greatly enhanced its impact through their guidance on its revision.
Footnotes
Contributors All authors gave considerable contribution to one or more of the following conditions for authorship: study design, data acquisition, analysis and interpretation of results, or intellectual content. All authors gave final approval of the manuscript for publication.
Funding This research was supported by the Federal Emergency Management Agency (FEMA) Assistance to Firefighters Grant Program, Fire Prevention and Safety Grants (Research & Development)––grant numbers EMW-2009-FP-00427 and EMW-2012-FP-00205.
Competing interests None declared.
Ethics approval Drexel University Institutional Review Board, DHS/FEMA Office of Research Compliance.
Provenance and peer review Not commissioned; externally peer reviewed.