Article Text

Abstract
Background Driver error and inadequate skill are common critical reasons for novice teen driver crashes, yet few validated, standardised assessments of teen driving skills exist. The purpose of this study is to evaluate the construct and criterion validity of a newly developed Simulated Driving Assessment (SDA) for novice teen drivers.
Methods The SDA’s 35 min simulated drive incorporates 22 variations of the most common teen driver crash configurations. Driving performance was compared for 21 inexperienced teens (age 16–17 years, provisional license ≤90 days) and 17 experienced adults (age 25–50 years, license ≥5 years, drove ≥100 miles per week, no collisions or moving violations ≤3 years). SDA driving performance (Error Score) was based on driving safety measures derived from simulator and eye-tracking data. Negative driving outcomes included simulated collisions or run-off-the-road incidents. A professional driving evaluator/instructor (DEI Score) reviewed videos of SDA performance.
Results The SDA demonstrated construct validity: (1) teens had a higher Error Score than adults (30 vs 13, p=0.02); (2) For each additional error committed, the RR of a participant's propensity for a simulated negative driving outcome increased by 8% (95% CI 1.05 to 1.10, p<0.01). The SDA-demonstrated criterion validity: Error Score was correlated with DEI Score (r=−0.66, p<0.001).
Conclusions This study supports the concept of validated simulated driving tests like the SDA to assess novice driver skill in complex and hazardous driving scenarios. The SDA, as a standard protocol to evaluate teen driver performance, has the potential to facilitate screening and assessment of teen driving readiness and could be used to guide targeted skill training.
Statistics from Altmetric.com
Introduction
In the USA in 2011, almost 2000 drivers between the ages of 15 years and 20 years died in MVCs, and an additional 180 000 young drivers suffered injuries, making MVCs the leading health threat to adolescents.1 Poor driving skill, such as failure to recognise hazards, inattention to the forward roadway, and driving too fast for local conditions, contributes to nearly three-quarters of teen driver crashes.2 ,3 Even though we can identify major contributors, methods to reduce crashes among novice teen drivers have been hampered by a lack of valid assessments that measure driving skill, particularly in complex driving situations. Given that teen drivers account for a disproportionately high percentage of crashes,4 and the resultant morbidity and mortality exerting a societal burden,5 validated, standardised assessment of teen driving skill is needed.
On-the-road assessments of driving performance with evaluators,6 while important and necessary, are limited in hazard exposure, and include threats to validity. Key factors, such as traffic and environmental conditions, cannot be replicated, and study designs cannot place teens in dangerous on-the-road driving situations. However, teens crash in complex and dangerous scenarios;7 ,8 therefore, assessment of how teens perform in these situations can provide important information for prevention strategies. Driving simulators could offer a replicable, safe complement to on-the-road evaluations;9 however, no validated driving simulator protocols to assess teen driver performance exist. Our goal was to create a standardised, replicable simulated assessment of teen driving performance in scenarios known to be associated with teen crashes, delivered within a driving simulator's safe environment.
We have undertaken a series of systematic steps to develop an assessment of teen driver performance: the Simulated Driving Assessment (SDA). The scenarios and measurement strategies in the SDA were theoretically grounded in actual crash data. The SDA was designed to expose drivers to complex driving scenarios that are often the cause of serious crashes and to measure their driving performance via key metrics determined from the empirical literature and expert opinion.10–17 Crash data from the National MVC Causation Survey (NMVCCS) were used to determine the SDA-simulated scenarios.18 ,19 The top three types of serious crashes (rear-end collisions, left turn intersection collisions, and right side run-off-the-road events) represented approximately 30% of NMVCCS teen crash configurations.19 Variations of these three types of serious crashes became the driving scenarios in the SDA so that the assessment would approximate the common real-world scenarios in which teen drivers crash; that is, have ecological validity.19 Initial analyses were carried out to help establish the usefulness of the SDA. We examined the potential for learning effects during the SDA and found no training effect or induced hypervigilance because of exposure to multiple potential crash scenarios in the SDA.20 Given that a driving evaluator instructor (DEI) often serves as the best available gold standard for assessing driving performance, we compared DEI-rated drivers’ performance during the SDA (a derived categorisation of skill/less skilled) to history of police-reported crashes. Seven of the eight (87.5%) experienced adult drivers who had at least one police-reported crash were categorised as less skilled by the DEI, resulting in a sensitivity of 0.87 (95% CI 0.47 to 0.99).21
Given this foundation, the purpose of this study was to assess the construct and criterion validity of the SDA for novice teen drivers, crucial tests of its usefulness for driver assessment. In order to evaluate the construct validity of the SDA, we: (1) compared safe driving performance measures among teens and adults (Error Score); and (2) assessed the ability of the SDA to predict Simulated Negative Driving Outcomes from the Error Score. In order to evaluate the SDA's criterion validity, we compared the Error Score to an expert criterion, an independent video review of SDA performance by a professional driving evaluator/instructor (DEI Score).
Methods
SDA procedures
The methods to develop the SDA scenarios have been described above. Prior to completing the SDA, participants drove an unscored familiarisation segment (∼7–10 min) to adjust to simulator dynamics. The SDA lasted approximately 35–40 min and included three modules that were randomised (by a random number generator). During the SDA, participants were exposed to 22 variations of the most common teen driver crash configurations (rear-end collisions, left turn intersection collisions, and right side run-off-the-road events).19 The 22 crash scenarios were distributed across the three modules, separated by intervening straight roads, curves and turns not intended to trigger collisions. The length between scenarios ranged between about 300 m and 1800 m, with an average of about 930 m. If the participant drove the SDA safely, crashes were avoidable. In order to decrease the potential for a learning effect, no feedback on performance was given to participants during or after the drive.20
SDA driving performance metrics
The 14 driving performance metrics scored during the SDA (determined by the empirical literature and expert opinion) represent key measurable driving behaviours, including basic (eg, use of turn signals) and advanced (eg, presence of hazard anticipation glances) manoeuvres. Table 1 outlines the definitions, calculations, sources of data and criteria for errors in each of the metrics, all of which were determined by on-the-road and/or simulator studies. Table 2 outlines the potential crash scenarios, number of occurrences in the SDA and errors (dichotomous) scored in the 22 potential crash scenarios.
Driving performance metric definitions, calculations and criterion for error
Scoring of driving performance metrics in potential crash scenario type
Apparatus
The Realtime Technology, Inc. (RTI) fixed-based driving simulator system used in this study included a driver seat, three-channel 46″ LCD (liquid-crystal display) panels (160° field of view), rear view, left and right mirror inlayed images, active pedals and a steering system. Visual rendering and graphics were delivered at 1280×1024 resolution at 60 Hz. Raw simulator data (eg, velocity, position) were collected at 60 Hz and were reduced to the 14 driving performance metrics as outlined in table 1. Videos of the participant's driving behaviour in the simulator were also recorded by three cameras (positioned over the right shoulder, pointing at the participant’s face and over the foot for view of brake and accelerator). Video playback data were assessed by the DEI (further described below).
Applied Science Laboratories’ (ASL) Mobile Eye was used to capture eye movements on the forward scene at 30 Hz. Participants wore a pair of glasses (or alternative goggles worn over eyeglasses) with two video cameras (forward image and right eye of participant) to capture gaze location during the SDA. Video data from the two cameras were integrated into a single video with superimposed cross-hairs for eye gaze location. Videos were used for coding in analysis as outlined in table 1.
Participants
Two groups were enrolled: (1) inexperienced teens (age 16–17 years, Pennsylvania (PA) provisional license ≤90 days); and (2) experienced adults (age 25–50 years, PA license ≥5 years, drove ≥100 miles per week, no collisions or moving violations ≤3 years).
Individuals were excluded for a self-report history of migraines or motion sickness, current pregnancy, or non-English speaking. Teen participants were recruited via mailings from paediatric primary care facilities, driving schools and word of mouth. Experienced adults were recruited via flyers, the Wharton Behavioral Lab at the University of Pennsylvania and word of mouth. Participants were compensated $50. Study procedures were approved by the institutional review boards at The Children's Hospital of Philadelphia and an administrative agreement with the University of Pennsylvania.
Main measures
Demographic data
Self-report data on age, gender, race/ethnicity and length of licensure were collected.
Error Score
Error Score was based on errors in 14 driving performance metrics in the 22 potential crash scenarios. Only errors relevant to a specific scenario were calculated (eg, turning from a correct lane was not scored in the rear-end events; see table 1 for calculations and table 2 for scoring). A minimum of 1 and maximum of 10 driving performance metrics were scored in each of the 22 scenarios. A sum score of errors in driving performance metrics was aggregated across potential crash scenarios (Error Score). Potential range of the Error Score was 0–117.
Simulated negative driving outcome (simulated collisions and run-off-the-road)
Each of the 22 scenarios had potential for a negative driving outcome, either a simulated collision or run-off-the-road incident. Only one simulated negative driving outcome could be assigned per scenario, whichever occurred first. Simulated collisions were defined as an overlap of the participant's vehicle with other vehicles programmed for the potential crash scenario. Collisions were derived from simulator data on position, orientation and dimensions of the participant and nearest vehicle, and were verified by video review. For five participants, automated simulator data for collisions were unavailable due to a programming error and were independently video coded and reconciled for 100% agreement by two research team members. Run-off-the-road incidents were defined as any instance of the vehicle perimeter departing the roadway (either side). Run-off-the-road incidents were derived from simulator data of participant vehicle position, orientation and dimensions. Possible range of total SDA simulated negative driving outcomes was 0–22.
DEI Score
A professional DEI with 20 years of driver training experience reviewed a four-quadrant divided screen of SDA video playback of the three scored modules (familiarisation segment excluded). The video included forward roadway, right foot behaviour (brake and throttle), and over the participant's right shoulder and face. Speed in miles per hour (mph) and left and right turn signals were displayed; however, no simulator or eye-tracking data or selected measures for scoring were provided to the DEI. The DEI was blinded to driver age and SDA Error Score. The DEI rated driving skill (scale 0–10; 0=unskilled and 10=proficient) in eight domains: attention maintenance, communication and right of way, gap selection, hazard anticipation and response, managing blind spot, road positioning, speed management and vehicle control. As previously stated, this DEI demonstrated a high sensitivity in identifying skill level in the SDA as related to previous crash history.21 A sum score was created (DEI Score) with a possible range of 0–80.
Analysis
Table 1 outlines metric definitions, calculations, sources of data and criteria for errors. Custom MATLAB (Mathworks, Natick, Massachusetts, USA) code was used to reduce raw simulator data. For categorical variables, frequencies and percentages were computed. For continuous variables, median, IQR, and full range were computed. Construct validity was examined by assessing the following hypotheses: (H1) teen drivers would have a higher Error Score than adults; and (H2) higher Error Score would predict increased propensity for a simulated negative driving outcome. The Wilcoxon rank-sum test and Fisher's exact test were used to compare teen and adult performance. A modified Poisson regression was used to estimate the RR and 95% CI to predict the total sum of simulated negative driving outcomes based on experience (inexperienced teen or experienced adult) and Error Score. Criterion validity was examined by assessing the following hypothesis: (H3) DEI score would be negatively associated with Error Score (eg, participants rated as more proficient by the DEI would have fewer errors or a lower Error Score). Spearman correlation was used to determine the association between Error Score and DEI Score. The videos viewed by the DEI included obvious collisions and run-off-the-road instances; therefore, the association between DEI score and negative driving outcomes was not examined. For hypothesis testing, the Type-I error rate was set at α=0.05. All statistical analyses were performed using R v3.0.1 (http://www.r-project.org).
Results
Our analytic sample included 38 participants who completed the SDA (see figure 1). The teen group included 21 participants: 33% female, 95.2% Caucasian, 4.8% African-American, 100% non-Hispanic, median age=16 years (IQR 16–17; range 16–17), with provisional license for a median of 35 days (IQR 7–44; range 1–88). The adult group included 17 participants: 41% female, 70.6% Caucasian, 23.5% African-American, 5.9% race not reported, 100% non-Hispanic, median age=34 years (IQR 28–42; range 25–50), licensed for a median of 15 years (IQR 11–22; range 8–33). There were no statistically significant differences between the teen and adult groups across sex, race and ethnicity. As expected, statistically significant differences between the teens and adults were observed for age (Z=5.40, p<0.001) and length of licensure (Z=5.23, p<0.001) (Wilcoxon rank-sum tests).
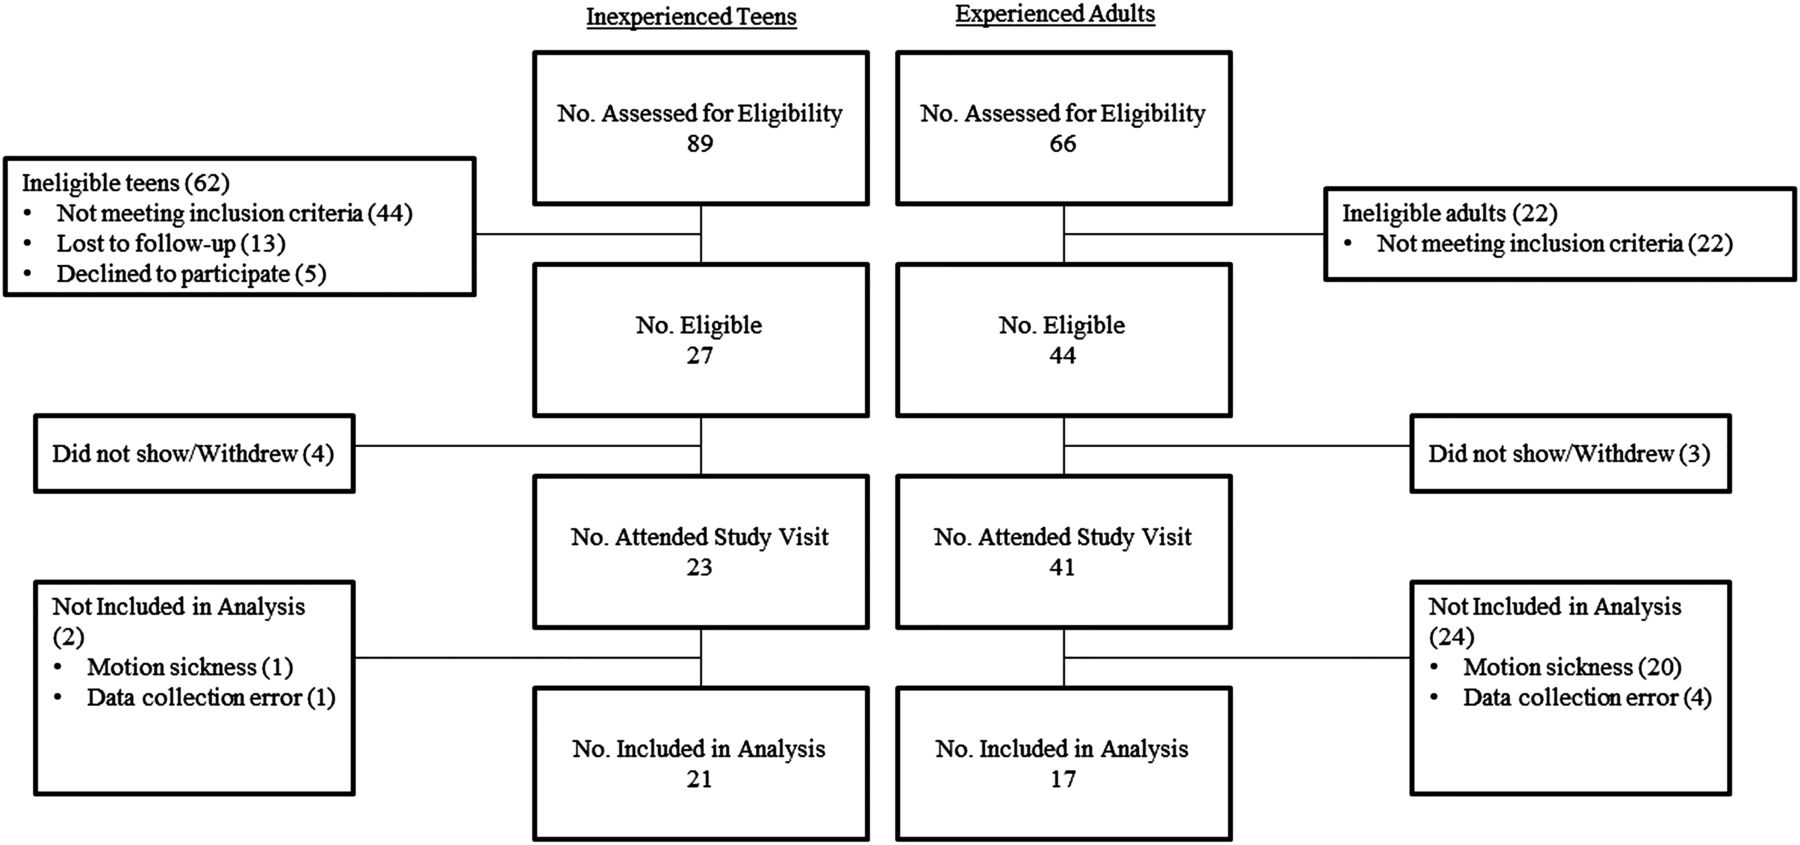
Derivation of analytical sample.
Table 3 includes the SDA Error Score and errors in each driving performance metric for teens, adults and the total sample. For the total sample, the Error Score range was 4–54 errors (teen range, 13–54; adult range, 4–50). Consistent with H1, teens had a higher Error Score than did the adults (Z=−2.37, p=0.02 Wilcoxon rank-sum test). Note, median and IQRs of errors and frequency of teens and adults with ≥1 error in each driving performance metric during the entire SDA are also reported in table 3; however, given the small sample, we consider comparisons between teens and adults exploratory and, thus, do not report p values.
Error Score, errors in each driving performance metric and simulated negative driving outcomes
During the SDA, 42.9% of teens and 29.4% of adults had at least one simulated negative driving outcome. Total sample range was 0–4 (teen range 0–3 and adult range 0–4); total sample median was 0 (IQR 0–2) (teens median 0 (IQR 0–2); adult median 0 (IQR 0–1)). There were no statistically significant differences in total simulated negative driving outcomes (Z=−0.80, p=0.43 Wilcoxon rank-sum test) between teens and adults or percentage of teens and adults with at least one simulated negative driving outcome (p=0.51, Fisher's exact test). Note: among negative driving outcomes, 94% were simulated collisions.
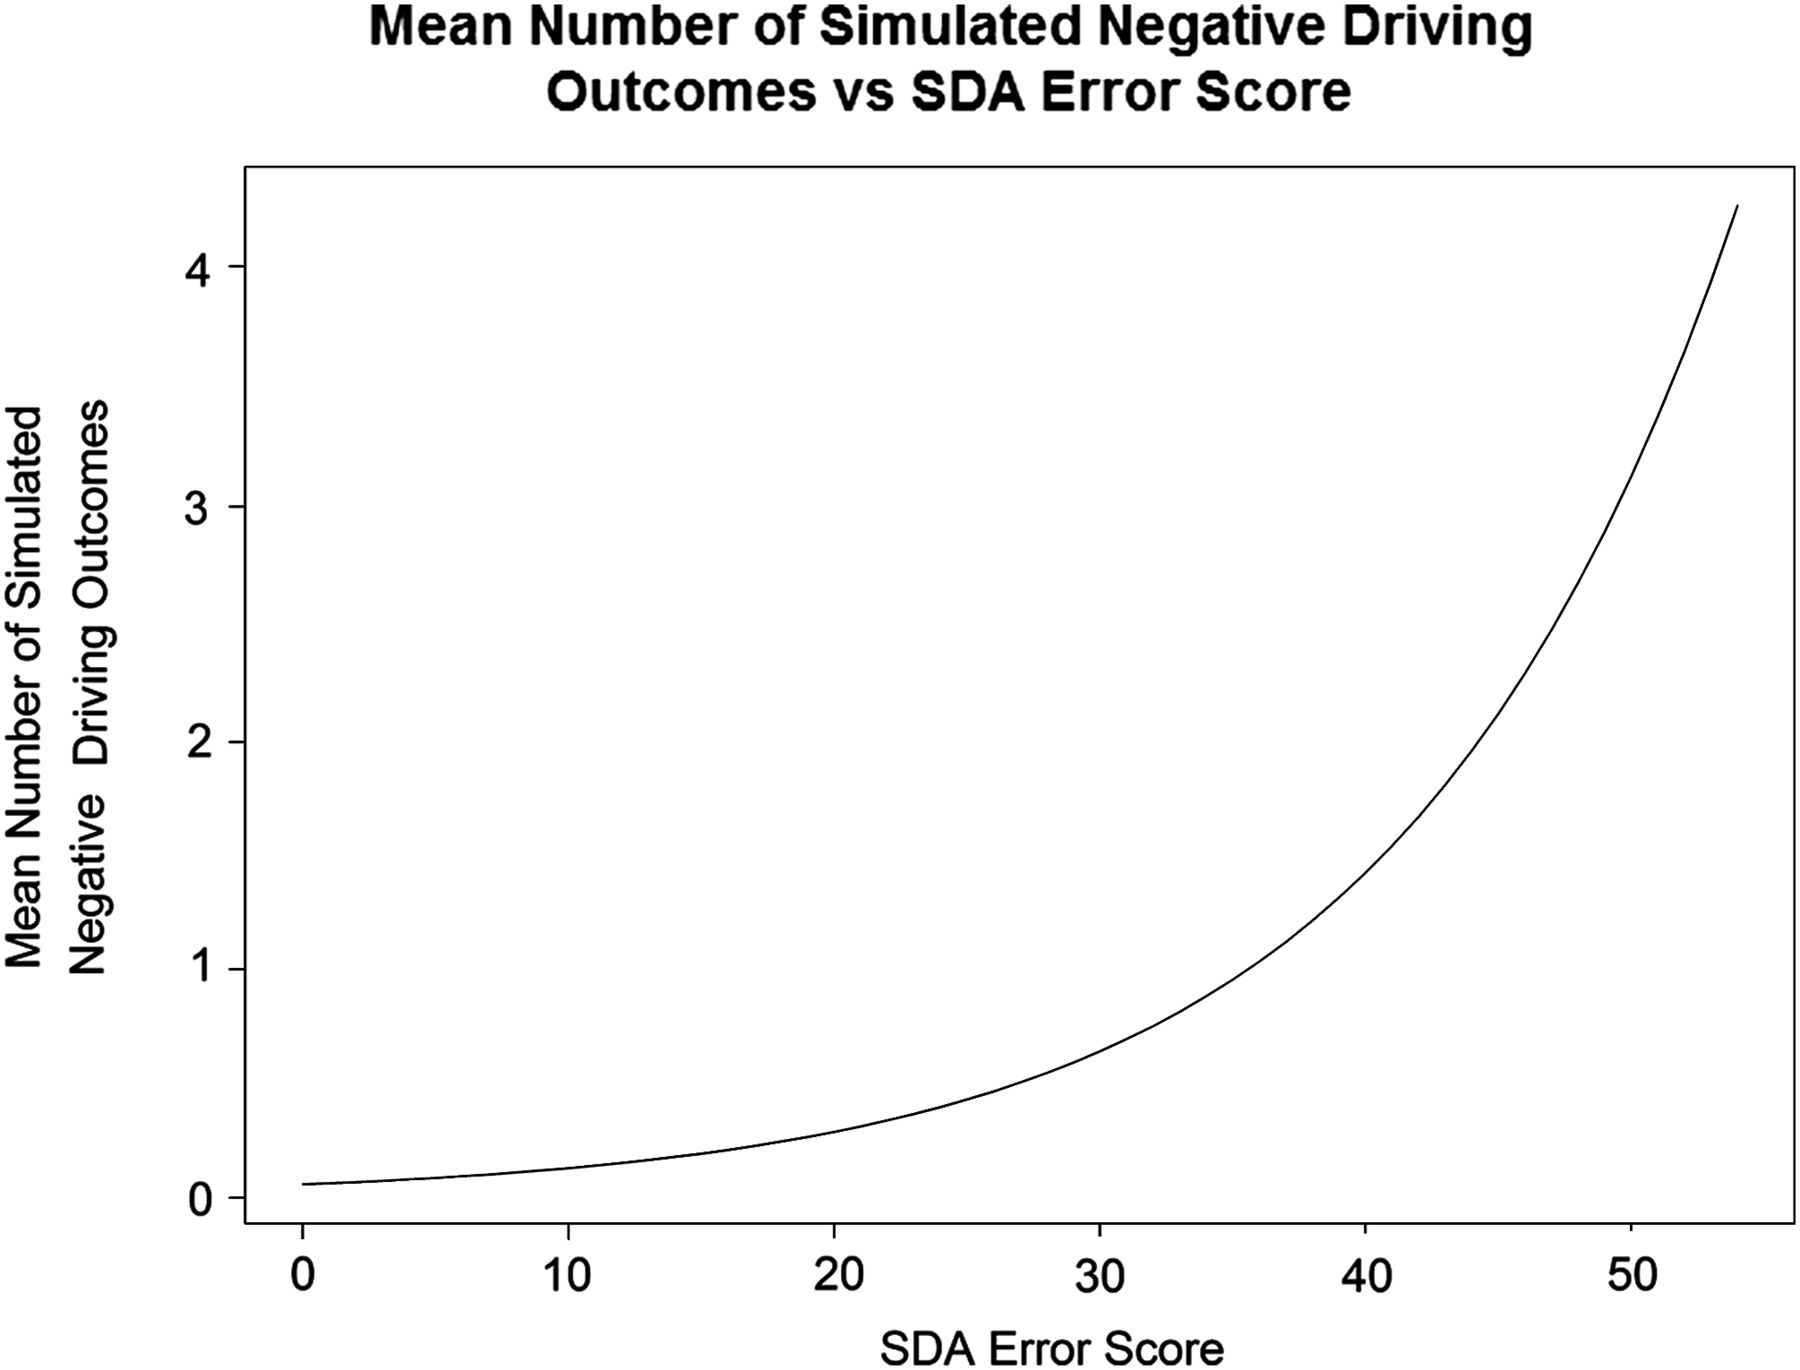
Consistent with H2, across all participants, for every one additional driving error, there was an 8% increase in the risk of a simulated negative driving outcome (RR=1.08; 95% CI 1.05 to 1.10, p<0.01). Figure 2 plots the exponential relationship between the propensity to have a simulated negative driving outcome (mean of lambda) and Error Score. Using a Wald test of the coefficients (Z=–0.36, p=0.72) and Akaike Information Criterion (AIC), experience was rejected as a covariate. Experience alone was not a significant predictor of simulated negative driving outcome (RR=1.38; 95% CI 0.67 to 3.04).
Mean number of simulated negative driving outcomes vs SDA Error Score.
DEI score ranged from 6 to 66 (teen range 23–66; adult range, 6–65) with a median of 46 and IQR 32–59 (teen median=46, IQR 34–58; adult median=46; IQR 32–61). There was no statistically significant relationship between DEI score and experience (Z=−0.25, p=0.80). However, consistent with H3, Error Score was significantly associated with DEI Score (r=−0.66, p<0.001).
Discussion
The results provide support for the construct and criterion validity of the SDA in its ability to differentiate driver performance by use of established safety metrics and to predict simulated negative driving outcomes. Teen drivers within 3 months of licensure made more total errors in the SDA than did experienced adult drivers. Furthermore, the SDA demonstrated a range in driver performance errors and a near linear relationship between Error Score and propensity to have at least one simulated negative driving outcome; with each error in the SDA, the risk for crashing or running off the road increased 8% (RR=1.08; 95% CI 1.05 to 1.10, p<0.01). Evidence for criterion validity is provided by the association between independent expert rating of driving performance and calculated scores of safety measures derived from simulator and eye-tracker data (r=−0.66, p<0.001).
The SDA Error Score, but not ratings from expert video review, showed a difference in driving performance between teen and adult drivers. The lack of association of video review and experience was likely due to potential limitations in video review for assessment of performance. Even though a DEI is often considered the best available standard for evaluation, the position of the DEI in a vehicle may limit ability to fully assess skill. For example, from the video review, the DEI was not able to precisely see where the participants’ were looking (ie, eye glance location) which is similar to the situation with on-road assessments where an evaluator's view may be restricted. Given that poor scanning contributes to novice driver crashes,2 ,3 a simulator and eye tracker can play an important role in assessing crucial skills like hazard anticipation and glance duration off the forward roadway.
A key goal of the SDA is to differentiate between skilled and non-skilled drivers; thus, we used experience as a proxy for skill. Although adults in our sample were experienced, they did not necessarily perform like skilled drivers. This is consistent with our previous research which revealed that the experienced adults, while eligible for the study, may have included drivers who were less skilled and less safe drivers: 8 of the 17 adults had at least one police-reported crash during their PA licensure, none that occurred during the 3-year window used in the study exclusion criteria.21 (Note: none of the inexperienced group had a police-reported crash prior to enrollment in the study). Therefore, our adult driver group contained some drivers who did not demonstrate the ‘gold standard’ for safe driving. This may, in part, explain why a statistical difference between the adult and teen group was found in Error Score, but we did not find that the SDA differentiated simulated negative driving outcomes based on experience. There was a trend, however, to suggest that teens may have more simulated negative driving outcomes than adults (42.9% vs 29.4%; RR=1.38, 95% CI 0.67 to 3.04, p>0.05). With the narrow distribution of the continuous count of crashes and dichotomous outcome variable (no crashes vs ≥1 crashes), analysis of crash counts was likely underpowered to detect statistical differences. Future validation of the SDA (and other studies that use adults as a skilled/safe driver comparison group) may need to use a larger sample and additional criteria that enhance exclusion of unskilled, unsafe drivers.
Some of our individual driving performance metrics had a median of 0 errors by teens or adults (eg, turn signal, lane choice). These metrics were included to provide face validity of the new SDA tool as these are common metrics used by driving assessors as part of licensing. However, future iterations of the SDA scoring may choose to refine or eliminate these metrics due to lack of variation among participants. Other metrics proved more variables, and demonstrated the usefulness of the tool and also the range of driving skill among the participants. Additionally, future research with a larger sample should explore how each error metric differs among teens and adults.
By examining multiple performance measures in scenarios designed to replicate the most common crash configurations, the SDA provides information about skill deficits in hazardous situations. These findings demonstrate the SDA's usefulness as a measure of driving skills known to be involved in teen driver crash risk. Teens displayed mastery of basic skills, such as using turn signals, but more advanced driving behaviours proved challenging. Teens had repeated errors of advanced behaviours, including braking in hazardous situations and hazard anticipation glances, and demonstrated repeated negative driving outcomes during the SDA. These results complement those from an evaluation of an on-road assessment demonstrating teens’ ability to perform basic manoeuvres but had deficits in more advanced, critical driving behaviours.22
This study is not without limitations. The simulated driving environment replicates but is not identical to on-the-road driving; however, the SDA's advantage is to safely expose teens to high-risk driving situations. Future prospective studies with larger samples should examine the ability of the SDA to predict teen driver on-road behaviour and crashes. The study inclusion/exclusion criteria limit the applicability of the results to the populations that were studied. Larger samples are needed to generalise results to the broader population or to special populations with medical and psychiatric conditions. The metrics for scanning (eg, scan left for intersection) were not an exact replication of scenarios and measurement of the hazard anticipation glances in the Fisher et al15 work. However, the emphasis of this metric on scanning in potentially hazardous situations was the basis for selection. Future work should further examine measurement strategies for scanning in the SDA. Incomplete performance data were available for 15 adults and 1 teen who stopped the SDA due to simulator sickness (see figure 1 for determination of sample). Overall, the percentage of adults with simulator sickness in our study (36.6%) is consistent with reports in the literature.12 For the stated purpose of the SDA—assessment of novice teen driver performance—the SDA resulted in minimal simulator sickness. This study focused on assessment of driving skill in relationship to experience as a marker of safe driving. A more comprehensive assessment of driving risk should also include risky driving and behavioural tendencies. A single-rater (DEI) with over 20 years of experience in driver training was used to assess video recordings, which was only one form of validity. In the future, the use of multiple raters might be of value, although we confirmed the ability of this DEI to accurately identify unskilled, unsafe drivers.21
Is injury proneness genetic?
A review paper in Clin J Sports Medicine suggests there may be a genetic basis for repeated injuries. One focus is on genes that control collagen production. Athletes who tore their anterior cruciate ligament were four times as likely as uninjured controls to have a blood relative who had the same injury. Another possible genetic marker relates to bone mineral density. Some evidence suggests that osteoporosis in older women and increased stress fractures in young women may be familial. (Noted by IBP)
Project Zero: towards injury-free India
In Mangalore, India, a city with a population of nearly one half million, the University has launched Project Zero, with the goal of eliminating all injury deaths in an unspecified period. The strategy is to “appeal to every responsible citizen of India to join and pledge road safety in mind and body, heart and soul”. It notes that “present efforts … to enforce law(s) and to deliver post crash treatment is minimal”. The rhetoric urges “Safe and slow driving, road manners, wearing helmet, seat belt and other necessary precautions …” (Noted by IBP)
New Ford includes many crash prevention features
The new hi-tech Ford S-Max car includes >20 injury prevention technologies as well as an Intelligent Speed Limiter. (Noted by IBP)
Conclusions
This study supports the validity of the SDA for use in a safe and replicable manner to assess novice driver skill in complex and hazardous driving scenarios. The SDA, as a standard protocol to assess teen driver performance, could facilitate screening and assessment of teen driving readiness, and could be used to guide targeted skill training.
What is already known on the subject?
-
Driver error and inadequate skill are the main contributors to teen driver crashes.
-
On-road assessments of driving performance are limited due to limited exposure (safety concerns) and replicability (variable traffic/environmental conditions).
-
There is a gap in validated assessments of teen driver skill, particularly in complex driving situations that have inherent risk.
-
Advanced driving simulators provide a realistic yet safe complement to on-road tests.
What this study adds?
-
This study demonstrated validity of the Simulated Driving Assessment (SDA) for safe evaluation of skill in high-risk driving scenarios.
-
A tool like the SDA could inform teen driving evaluations and guide individualised driver training and management plans.
Acknowledgments
We would like to acknowledge the Simulator Program at the Center for Injury Research and Prevention, directed by Yi-Ching Lee, PhD, and coordinated by Dana Bonfiglio; Jason Tanenbaum, Dana Bonfiglio, and student research assistants for their role in data collection and analyses; Donald Fisher, PhD, and Daniel Mayhew, MA for their assistance in determining the domains and scenarios and Matthew Romoser, PhD, for his assistance in programming the scenarios; Michael Elliot, PhD, for his statistical guidance; Marilyn S Sommers, PhD, RN and Nancy Kassam-Adams, PhD for their guidance during the study and thoughtful review of the manuscript; Gerald Murphy for his assistance with this study; the Wharton Behavior Lab; Pediatric Research Consortium at The Children's Hospital of Philadelphia; and the study participants without whom the research would not have been possible.
Footnotes
-
Contributors CCM, Y-CL and FKW contributed to the conception and design of the study, acquisition of data, and analysis and interpretation of data; drafting and critical review of the manuscript; and approval of the final manuscript. Kandadai contributed to the acquisition of data, and analysis and interpretation of data; drafting and critical review of the manuscript; and approval of the final manuscript. HL, TSS and ZW contributed to the analysis and interpretation of data; drafting and critical review of the manuscript; and approval of the final manuscript.
-
Funding This project is funded, in part, under a grant with the Pennsylvania Department of Health (PI: Flaura K. Winston). The department specifically disclaims responsibility for any analyses, interpretations or conclusions. Dr Catherine C McDonald was supported by the National Institute of Nursing Research of the National Institutes of Health under Award Number K99NR013548. The content is solely the responsibility of the authors and does not necessarily represent the official views of the National Institutes of Health. The authors would also like to acknowledge the National Science Foundation (NSF) Center for Child Injury Prevention Studies at the Children’s Hospital of Philadelphia (CHOP) for partial support of Flaura K Winston (NSF Grant ID: 1034593) and for student support (NSF Grant ID: 1451897) for this study. The views presented are those of the authors and not necessarily the views of CHOP or the NSF.
-
Competing interests None.
-
Ethics approval The Children’s Hospital of Philadelphia and an administrative agreement with the University of Pennsylvania.
-
Provenance and peer review Not commissioned; externally peer reviewed.