Article Text

Abstract
Background Unlike the UK or New Zealand, there is no standard set of census variables in the USA for characterising socioeconomic (SES, socioeconomic status) inequalities in health outcomes, including injury. We systematically reviewed existing US studies to identify conceptual and methodological strengths and limitations of current approaches to determine those most suitable for research and surveillance.
Methods We searched seven electronic databases to identify census variables proposed in the peer-reviewed literature to monitor injury risk. Inclusion criteria were that numerator data were derived from hospital, trauma or vital statistics registries and that exposure variables included census SES constructs.
Results From 33 eligible studies, we identified 70 different census constructs for monitoring injury risk. Of these, fewer than half were replicated by other studies or against other causes, making the majority of studies non-comparable. When evaluated for a statistically significant relationship with a cause of injury, 74% of all constructs were predictive of injury risk when assessed in pairwise comparisons, whereas 98% of all constructs were significant when aggregated into composite indices. Fewer than 30% of studies selected SES constructs based on known associations with injury risk.
Conclusions There is heterogeneity in the conceptual and methodological approaches for using census data for monitoring injury risk as well as in the recommendations as to how these constructs can be used for injury prevention. We recommend four priority areas for research to facilitate a more unified approach towards use of the census for monitoring socioeconomic inequalities in injury risk.
This is an Open Access article distributed in accordance with the Creative Commons Attribution Non Commercial (CC BY-NC 4.0) license, which permits others to distribute, remix, adapt, build upon this work non-commercially, and license their derivative works on different terms, provided the original work is properly cited and the use is non-commercial. See: http://creativecommons.org/licenses/by-nc/4.0/
Statistics from Altmetric.com
Introduction
In the USA, the burden of injury is neither equally nor equitably distributed.1–7 In particular, it follows a social gradient, whereby risk increases with each decrease in socioeconomic position or status (SES).8 Those in the lowest SES classes are particularly at risk.9 Both Canadian and US studies have shown that 40–48% of the population-attributable risk of injury can be accounted for by socioeconomic inequalities.10 ,11
Apart from national surveys,12 ,13 demonstrating either a relationship with or a gradient across SES classes using hospitalisation data is primarily accomplished using US census data. Through geocoding, patient address information from billing records can be linked to census-based geographical and socioeconomic records for their neighbourhood, zip code, and county of residence. This requirement is a compromise to account for the lack of individual or household SES data in the registries. Hospital registries, for example, contain little socioeconomic information other than categorical data on patient race/ethnicity and insurance status, both of which are tenuous if not substantiated with additional SES measures.14
There are four inherent advantages to using the census to ascertain disparities in injury risk. First, its data categories and geographies are commonly used in health policy and health promotion.15–17 Another is that the decennial questionnaire remains fairly consistent between cycles, which allows for consistency in measurement over time.18 Another is that census geographies capture information about place-based influences on health, something that individual-level data do not.19 Lastly, unlike national population health surveys, census-derived data can be readily produced and corroborated with hospitalisation records through geocoding.
Notwithstanding these advantages, a primary and methodological limitation is that unlike in the UK and New Zealand,20 ,21 there is no standard set of census variables in the USA for monitoring health outcomes. Instead, associations are drawn from several independent studies across the country. Although higher SES tends to predict lower injury risk, however measured, the pattern is not always consistent.22 ,23 Conceptual differences in how SES is defined may contribute to this problem. For example, that not all SES constructs are equally associated with health inequalities is a topic rarely broached in the injury literature.24
Just as monitoring the quality of trauma care requires evidence-based tools, monitoring socioeconomic inequalities in injury risk requires constructs that are theoretically justified and supported by evidence. However, it is unclear if the SES constructs currently in use meet either criterion. Exacerbating this issue is the lack of national reporting on SES and injury. As of yet, neither the National Center for Injury Prevention and Control nor the National Trauma Data Bank produce annual reports of injury statistics by SES, despite evidence that that social inequalities in health are increasing.25 ,26 The purpose of this review is to add to the knowledge base concerning the use of census SES data to quantify injury risk, particularly by identifying opportunities for greater consistency in how registry and census data are used for healthcare policy and injury prevention.
Methods
Search strategy
Relevant articles were identified from seven electronic databases, including: BioMed Central, CINAHL, the Cochrane database, MEDLINE, PsychINFO, Sociological Abstracts and Web of Science. To increase the sensitivity of our review, we also handsearched the Journal of the American College of Surgeons, Injury Prevention, and the Journal of Trauma and Acute Care Surgery using the keywords ‘census’ and ‘socioeconomic’ to identify additional US studies measuring injury risk using socioeconomic variables derived from the census. Each database and journal was searched between 1 October 2013 and 30 November 2013.
Search terms were developed to reflect the three research domains relevant to the study objectives: (1) injury, (2) socioeconomic conditions and (3) census-based measurement. From the literature, we identified medical subject headings (MeSH) and keywords associated with each domain of knowledge. The following MeSH were used to identify articles within the injury domain: wounds and injuries, accidents and trauma centers. MeSH terms and key words used to identify articles within the socioeconomic conditions domain included: demography, educational status, population dynamics, urban population, occupations, social class, socioeconomic factors, socioeconomic, deprivation, health status disparities, poverty, poverty areas, deprivation index, and health status indicators. The census-based measurement domain was constructed using the keyword census. Search terms from each domain were then intersected. The first search strategy was developed for the MEDLINE reference database, with subsequent searchers of the remaining databases derived using this taxonomy.
Article selection
We selected for full-text review all articles that were derived using numerator data from US hospital discharge summaries, trauma registries or vital statistics records. As per our criteria, socioeconomic variables were to be derived using census variables. This resulted in the exclusion of studies that derived their measure of SES from national or prospective surveys, or occupational health and safety databases. A second exclusion criterion was that patient race/ethnicity or insurance status was not the primary construct of SES. Lastly, we included only articles that either reported a statistical association between injury and SES (eg, β-coefficient) or reported rates across SES classes (eg, histograms, ORs). Our rationale for first criteria was to identify studies that most likely classified injury using standard inclusion rules. Our rationale for the second criteria was based on the predominant evidence that socioeconomic differences between racial groups are largely responsible for observed patterns of racial disparities in health status.27 Our rationale for the last exclusion criteria was to enable a comparison of constructs that have been applied in practice. We did not specify criteria in which injury cases were excluded by severity, hospital length of stay, age or injury type.
Article review
Eligible articles were identified through three screening phases. First, all authors reviewed manuscript abstracts of retrieved publications, selecting for further review those articles that were most likely derived through linking registry and census records. Next, two authors (NB and AA) independently evaluated manuscripts selected for further review. One author (SAA) intervened when consensus was not reached. Second, each manuscript selected for full-text review was evaluated for content. This included documenting the census variables used, how it was they were constructed, and whether statistical associations were derived from composite (eg, principal component analysis) or pairwise (eg, regression coefficient) comparisons. We also documented whether a social gradient was assessed, the theoretical methods that were discussed, the rationale for the variable selection, and recommendations for prevention. Lastly, articles were classified and collated by cause of injury and SES. For all studies, we counted each variable association in the event that a study reported multiple comparisons with different injury causes, age or race/ethnic groups.
Results
The literature search resulted in 1392 articles that had the potential to meet our search criteria. After removing duplicates, 1247 titles remained for screening. A review of titles and abstracts led to the retrieval of 76 articles for further review. We identified by consensus 33 articles for full evaluation. Of these, 29 articles were identified from our search criteria, 2 from article references, and 2 from hand searching journal websites. A flow chart of the manuscript review process is provided in figure 1.

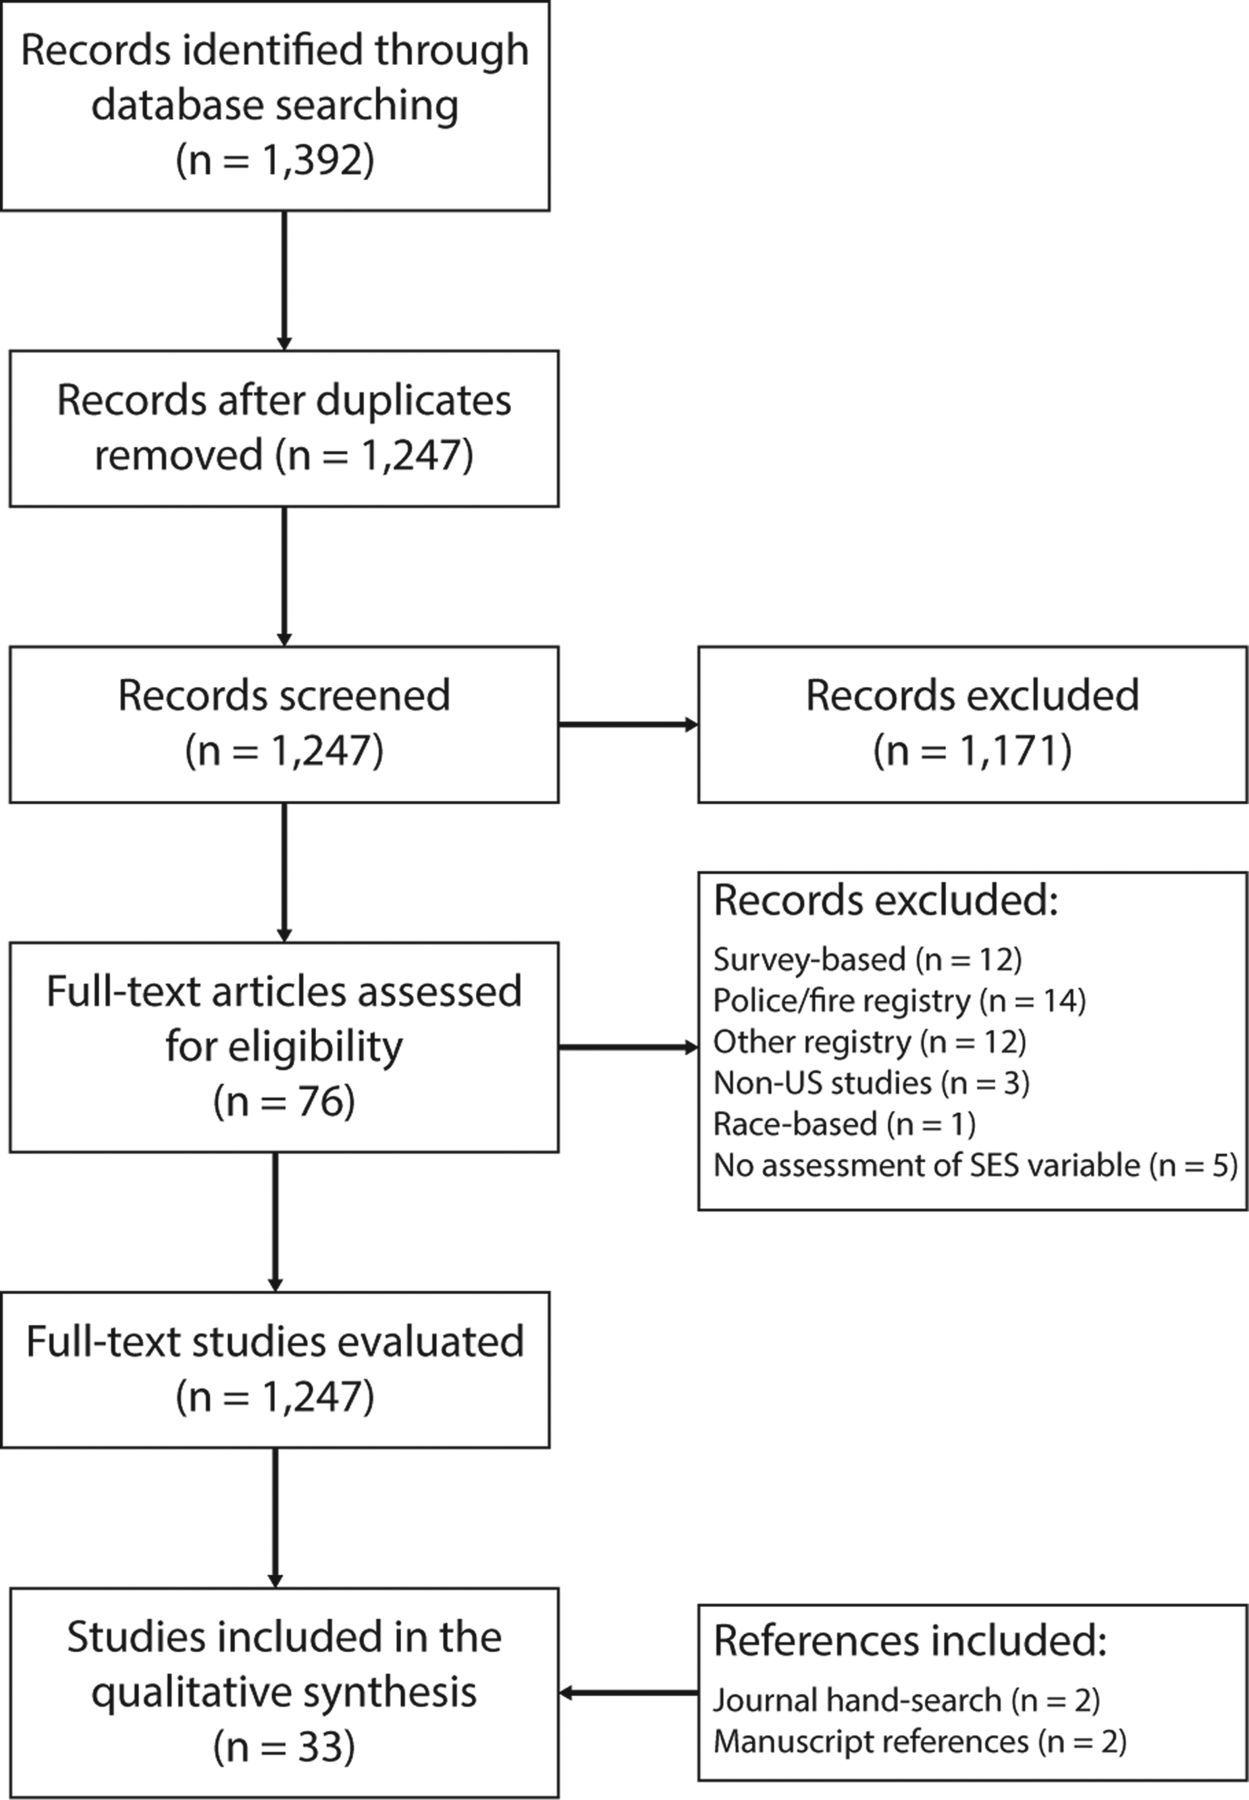
Schematic representation of the manuscripts identified at different phases of the review.
Table 1 lists the manuscript IDs and reference information for all original studies that were reviewed. Table 2 summarises the conceptual and methodological approaches and principal findings comparing the SES constructs to injury risk.
Reference key of original research articles reviewed
Characteristics of articles selecting socioeconomic status (SES) constructs from the census to estimate socioeconomic differences in injury risk/outcome
In total, we identified 70 different SES constructs from the literature. As a method of organisation, we classified each construct into one of eight domains. The Cultural domain contains variables that were defined by a measure of language. The Demographics domain contains variables that described the household in terms of composition, mobility, age or abilities. The Education domain contains variables that were used to define primary, secondary or postgraduate education. The Ethnicity domain contains variables that described an area's racial or ethnicity composition. The domain Housing contains variables that described the dwelling category, as well as housing types and structures and household size. The Income domain contains variables that defined permanent wealth (eg, home value) as well as distributed or central tendency measures of annual income. The Occupation domain contains employment-related variables and rates. The Population domain contains constructs that defined an area's population size or its administrative designation, such as urban or rural.
Overall, 82% of the constructs either produced a statistically significant relationship with an injury cause or demonstrated a social gradient across SES classes. Ranking the domains based on the number of instances where its constructs produced either of these effects places the Demographics domain first at 100% of attempts, followed by the Occupation (98%), Ethnicity (86%), Income (80%), Cultural (80%), Education (78%), Population (78%) and Housing (50%) domains. When stratified by a methodological approach, 74% of all pairwise comparisons demonstrated either a statistically significant association with an injury cause or produced a social gradient across SES classes. In contrast, 98% of all studies that aggregated census constructs into a composite index produced this effect.
We identified nine different constructs used to capture the extent of deprivation in terms of secondary or post-secondary education and training in a local area. Of these, six constructs were specific to high school educational attainment.11 ,28–32 Overall, each education construct was attributed to an increased risk of injury with the exception of when an area's proportion of high school attainment was stratified by ‘percentage male’ or ‘percentage female’ or by total years of maternal education.
Five different ethnicity-focused SES constructs were identified in the articles. The predominant construct was the percentage of black population per census area33–36 and the percentage of non-white population.30 ,32 ,37 ,38 All constructs were statistically significantly associated with rates of injury in at least one study. The least representative measure of SES was the proportion of an area's Hispanic population.39
Five different constructs relevant to an area's demographic make-up were identified in the literature. Two measures were variations on an area's proportion of lone parent families.11 ,29 ,30 ,32 ,39 ,40 Other constructs included the ‘proportion of men’,37 the ‘proportion of population ages 59 years or older’40 and the proportion of population having moved in the past 5 years.31 Each measure was statistically significantly associated with injury when evaluated in pairwise comparisons or when aggregated into a composite index.
We classified 12 different constructs into the Housing domain. Each construct addresses a component of deprivation pertaining to the living environment. Of these, four different measures were identified that addressed household overcrowding, such as the proportion of households with more than one person per room.29 ,34 ,39 ,41 ,42 The remaining constructs were either specific to housing structure34 ,36 ,39 ,43 or zoning/rental status.40 ,42 ,44 When evaluated, only 3 of the 14 pairwise (21%) evaluations of household overcrowding were associated with either injury risk or a social gradient in injury risk.
A total of 20 different constructs were used to measure the relationship between income and injury. The majority of constructs reflected either measures of central tendency (eg, median income) or distributed income (eg, below poverty). In total, median/mean income was constructed in eight different ways.11 ,28 ,30–32 ,34 ,35 ,37 ,38 ,40 ,42 ,45–53 Distributive measures of income were represented in seven different ways, such as concentrated poverty,36 ratios of income distribution,42 ,44 or using various percentages of populations or population groups below the poverty line.11 ,28 ,32 ,34 ,37 ,40–42 ,52 ,54 ,55 Other frequently used constructs were measures of permanent income or wealth, such as car ownership or housing value.11 ,42 When compared with rates of injury, distributive measures of income were significant in 22 of 26 comparisons, whereas measures of central tendency were significant indicators of injury risk in 23 of all 37 tests.
We classified six different SES constructs into the Occupation domain. Of these, four were various measures of an area's unemployment rate, such as the percentage of unemployed males, the overall unemployment rate, or the proportion of mothers not employed.11 ,29 ,32 ,35 ,42 ,47 ,56 Other constructs included the proportion of white collar occupations, the proportion of working class occupations, and the Duncan SES index.11 ,42 ,57 With the exception of the Duncan SES index, which is a measure of occupational prestige, all constructs were significant indicators of injury risk.
Both the Cultural and Population domains contained constructs that were evaluated less frequently than constructs included in the other six domains, though each domain contained indicators that were statistically significantly associated with injury risk overall. Online supplementary appendix 1 tables A1-A8 summarise the frequency of statistically significant associations observed when each SES construct was assessed singularly or as a composite indicator for each cause of injury.
Overall, the proportion of publications producing a reference or justification for the SES variables included in their approach was low. For example, a reference or supporting claim as to why the SES variable was chosen was missing in nearly half (42%) of all studies. Less fewer than half of the studies (45%) we reviewed provided a complete description on how the variables were constructed, such as listing the census category where the variable originated, or how its numerator and denominator proportions were calculated.
Discussion
In our review of literature, we identified 70 different census constructs that have previously been used to characterise socioeconomic determinants of injury risk. Of these, fewer than half were replicated by other studies or against other causes, making the majority of studies non-comparable. Variation in measurement occurs as a result of defining similar constructs differently. It is also attributed to inconsistency in how researchers conceptualise the purpose of SES for injury prevention. For example, should emphasis be placed on changing behaviour by targeting the most vulnerable,29 ,31 ,32 ,38–40 ,45 ,50 ,51 ,54 ,55 ,58–60 mitigating the effects of social inequalities,30 ,36 ,46 ,47 ,53 ,56 or both?11 ,37 ,43 ,44 ,48
Over the past two decades, there has been significant discussion over the use of the census for monitoring social determinants in health.61–63 Previous reviews from the injury literature have similarly discussed some of the inherent weaknesses in how SES is conceptualised.64 Building on these discussions, we recommend four priority areas in efforts to facilitate a more unified approach towards the use of registry and census data for injury prevention and control.
First, there is a need for greater conceptual and methodological agreement for selecting census constructs to characterise injury risk. Not all SES constructs are equally attributable to injury risk. We found that the likelihood of injury was more strongly associated with measures of relative poverty when measured in conjunction with the level of education,31 ,32 ,40 but not when measured using median income.32 ,40 Employment-related variables were more indicative of unintentional rather than intentional injury.42 Permanent income or wealth-related constructs produce narrower IRRs than measures of average or relative income,42 which run in contrast to previous evidence.65
Nor are all indicators of SES specifically relevant to injury risk. For example, household overcrowding and mean household income were inconsistent measures of injury risk compared to other constructs within their domains. In contrast, factors including the unemployment rate, the proportion of female lone parent families, and the percentage of the population below the poverty line were consistently more indicative of injury risk for all injury causes. It is worth emphasising that the income constructs were less consistent indicators of injury risk, on average, than demographic and occupational constructs.
One recommendation proposed by Krieger et al42 and subsequently either directly55 or indirectly40 ,44 ,52 supported by trauma researchers is to monitor health inequalities using a single indicator: the percentage of persons below the federally defined poverty line. Poverty measures are one of the strongest measures of health inequities as they take into account the number of adults and children dependent on family income. Similarly, poverty is strongly correlated with a host of other factors, including lack of amenities, poor education, unsafe working conditions, unemployment, neighbourhood crime, and its consequential effect on family life. The studies we reviewed support this position as distributive measures of income were more consistently related to injury risk than measures of central tendency.
An important distinction in Krieger et al's42 recommendation is that area poverty rates should be expressed in percentages to emphasise the proportion of population within its bounds as opposed to being used as a dichotomous marker. The distinction is that the latter method emphasises those populations that fall into the ‘tailings’ of a distribution, while the former emphasises the incremental impact of inequities across all populations. If in fact there were a threshold in relationship between injury and income (which no study found), it would still require looking further along the gradient to determine when its effect weakens.
However, our review suggests that no single census construct exists that reflects the complexities of social inequalities in injury risk. Rather, social advantages and disadvantages are attributable to multiple, interrelated causes, including income distribution, occupation type and working conditions, racial tensions, family demographics, and accessibility to educational opportunities, among others. The fact that composite indicators of SES were statistically significantly related to injury in 98% of all analyses supports the premise that the most consistent markers of injury risk appear when constructs are combined. While there is value in selecting a single indicator to represent social inequities in health, particularly for policy-related directives, there is also value in understanding the combined effect of its determinants. In this vein, we recommend testing the utility of the Health Disparities Calculator to facilitate comparisons of multiple determinants of injury, as well as support comparisons with other health outcomes using a common metric.66
Second, greater emphasis needs to be placed on measuring the interactions between race/ethnicity and insurance status with SES. A prevailing trend in the trauma literature is the use of patient race as an indicator of SES.67–70 This practice is multifaceted, as race is a mandated data field for federal statistical reporting agencies. Its use is also by necessity as hospital and trauma registries typically lack other individual-level SES identifiers. However, previous studies have shown that differences in SES are largely responsible for racial disparities in injury risk.71 ,72
Some studies we reviewed corroborated these findings. For example, Pomerantz et al32 found that patient race was no longer a significant childhood injury indicator after adjustment for poverty and for educational and unemployment factors. Similarly, Ladha et al,51 adjusting for neighbourhood income, removed the significance of patient race as a determinant of re-presentation to the emergency department following discharge. However, we also found that adjustment for SES reduced but did not eliminate racial disparities in injury. For example, Fabio et al37 observed that race remained a significant individual-level determinant of violent injury after adjusting for county-level segregation, though the authors also demonstrated that when stratified by race, segregation was a significant indicator for both white and non-white trauma. Hinton et al34 found that an area's percentage of black populations remained an independent predictor of childhood trauma after adjustment for SES.
Insurance status, often treated as a surrogate for SES, is susceptible to similar nuances as race/ethnicity when considered an independent (and individual) predictor of injury risk. Numerous studies we reviewed included insurance type as a covariate in the regression analysis.37 ,46 ,48–51 ,55 While some studies we reviewed found that insurance status was associated with neighbourhood SES,51 other studies failed to find this association.48 Variability in the relationship between insurance status and SES is further complicated by the confounding effect of inadequate coverage on pre-injury health, particularly among minority trauma patients.9
These findings emphasise the importance of testing for interactions between race, insurance status, SES and injury. Without this, we risk reinforcing prejudices and perpetuating racial stereotypes.27 We also risk misinterpreting the significance of which populations are most impacted by social inequities. For example, Almgren et al56 found that joblessness and family disruption, while being significant indicators of violent injury, were far more predictive of injury among black than non-black populations.
Third, studies should routinely evaluate the effect of injury risk across socioeconomic classes. What was fundamentally clear from the literature is that injury risk—regardless of cause—follows a social gradient.11 ,30 ,42 ,46 ,55 ,58 ,60 Thus, it is not specifically the poor or ethnic minorities who are the most vulnerable, but also those with higher incomes. Central to this thesis is that social disparities affect all population classes, not simply those without the resources to escape poverty.73
Lastly, we recommend that hospital and trauma registries expand the level of socioeconomic information collected on injured patients. A challenge inherent in the use of census or any area-level variable is the uncertainty as to whether these constructs are representative proxies for individual or household data. In part, this is an underlying rationale for using multilevel modeling to measure the association between area-level determinants after adjusting for individual-level characteristics. Multilevel frameworks help to disentangle the multitude of factors that influence individual behaviour, family and social networks, to community, and wider social and structural causes,74–76 concepts that were articulated in articles we reviewed pertaining to effects of racial segregation,37 social cohesion41 or social disorganisation.44 Expanding individual-level data collected by registries would improve knowledge of the characteristics of individuals that either protect or expose one to injury.
While multilevel models help tease out influences of multiple determinants of health, researchers have stressed that the individual-level characteristics are shaped by, as opposed to independent from, macrolevel determinants.76 These are compelling reasons to research which census constructs are the most representative of characteristics of individuals that are determinants of injury. Similarly, if data for both individual-level and area-level SES on all trauma patients were available, we could more meaningfully depict how rates of injury by race/ethnicity change as SES changes. Presently, such evaluations are primarily possible using national survey data, but these information sources cannot be as readily produced as registry data, nor can any relationship be corroborated with hospitalisation records.
Limitations of this review include the focus on published, peer-review literature and on studies where numerators were derived from hospital/trauma registries. We excluded studies that were derived using police or fire databases, as well as national cross-sectional or longitudinal studies. Despite this focus, this study is the first attempt to systematically review how US census SES constructs are used for measuring injury risk.
Conclusion
Through geocoding, patient address information from billing records can be linked to census-based geographical and socioeconomic records. This ensures that in the absence of having access to additional information on individual or household SES, there are readily available data to draw linkages between SES, or position, and health. A benefit of this approach is that the evidence is consonant with reporting practices among those engaged in health policy and health promotion. Another is that census data illustrate the profound impact that the social environment has on health. Our review of the injury literature, however, suggests that we are not yet fully exploiting these opportunities.
Many studies use SES as a means to target interventions towards populations that are most vulnerable. In contrast, few studies use SES as a means to ask why injury risk continues as socioeconomic position increases. Variation in how we conceptualise the purpose of these data to support injury prevention is conflated by the various ways in which SES is measured. In our view, there is thus far little justification for using 70 different SES constructs to explain the link between social status or position and injury. Based on our review, census constructs that require closer and more frequent examination include the percentage of lone parent families, the percentage of population below the poverty line, area unemployment rate, and the percentage of non-high school graduates.
What is already known on this subject
The importance of social determinants of injury inequalities is well established.
There is increasing emphasis to use census socioeconomic data to direct injury prevention towards the most vulnerable as well as advocate for inequities in access to resources known to be determinants of health.
However, there is no standard set of census variables to monitor inequalities in injury risk nor is there a common conceptual or methodological framework to structure evaluations.
What this study adds
This study synthesises the census variables thus far used to measure socioeconomic determinants of injury risk through classifying each construct into specific domains, thus identifying where there is variability in measurement as a result of defining similar constructs differently.
This study summarises which census constructs have thus far proven to be significant indicators of injury risk as well as those that remain inconsistent or non-significant indicators, thereby suggesting which measures may have the most impact on addressing injury inequalities.
Evidence of a social gradient in injury risk is evident across all causes of injury, yet the majority of studies focus on the relationship between low social class and injury; nor is there a common conceptual or methodological approach in how these variables should be used for prevention, suggesting the need for a more organised approach for using the census for injury prevention.
Firearm-related hospitalisations
A retrospective study at the University of Washington compared the risk for subsequent violent injury, death, or crime among patients with a firearm hospitalisation, hospitalisations for non-injury reasons, and the general population. The results show that hospitalisation for a firearm-related injury is associated with a much greater risk for subsequent violent victimisation or crime. More research is needed at the intersection of clinical care, the criminal justice system and public health. Comment: Too often we overlook the role of the justice system - noted by IBP.
Action on fake motorcycle helmets
Previously we reported on the growing number of cheap novelty helmet imports linked to motorcycle crash deaths. The risk of serious head injury from the novelty helmets is almost triple. To reduce the number of such helmets and make it easier for state law enforcement officials to identify them, it is proposed that distributors must comply with existing standards and limit their ability to ‘insulate themselves from legal liability’. Comment: Too often the law seems to favour large companies - noted by IBP.
References
Supplementary materials
Supplementary Data
This web only file has been produced by the BMJ Publishing Group from an electronic file supplied by the author(s) and has not been edited for content.
Files in this Data Supplement:
- Data supplement 1 - Online supplement
Footnotes
Contributors NB conceptualised and designed the study and drafted the initial manuscript. All authors reviewed the manuscripts and summarised the study findings; participated in the review and critical appraisal of the intellectual content; and gave final approval of the version to be published and agree to be accountable for all aspects of the work.
Funding This research was published in part through the Social Sciences Grant Program, awarded by the Office of the Provost, University of South Carolina.
Competing interests None.
Provenance and peer review Not commissioned; externally peer reviewed.
Data sharing statement The EndNote database of the reference collection is available from the authors on request.