Article Text

Abstract
Background Every year, injuries cost the Canadian healthcare system billions of dollars and result in thousands of emergency room visits, hospitalisations and deaths. The purpose of this study was to explore the relationship between neighbourhood socioeconomic status (NSES) and the rates of all-cause, unintentional and intentional severe injury in Greater Vancouver adults. A second objective was to determine whether the identified associations were spatially consistent or non-stationary.
Methods Severe injury cases occurring between 2001 and 2006 were identified using the British Columbia's Coroner's Service records and the British Columbia Trauma Registry, and mapped by census dissemination areas using a geographical information system. Descriptive statistics and exploratory spatial data analysis methods were used to gain a better understanding of the data sets and to explore the relationship between the rates of severe injury and two measures of NSES (social and material deprivation). Ordinary least squares and geographically weighted regression were used to model these relationships at the global and local levels.
Results Inverse relationships were identified between both measures of NSES and the rates of severe injury with the strongest associations located in Greater Vancouver's most socioeconomically deprived neighbourhoods. Social deprivation was found to have a slightly stronger relationship with the rates of severe injury than material deprivation.
Conclusions Results of this study suggest that policies and programmes aimed at reducing the burden of severe injury in Greater Vancouver should take into account social and material deprivation, and should target the most socioeconomically deprived neighbourhoods in Greater Vancouver.
This is an Open Access article distributed in accordance with the Creative Commons Attribution Non Commercial (CC BY-NC 4.0) license, which permits others to distribute, remix, adapt, build upon this work non-commercially, and license their derivative works on different terms, provided the original work is properly cited and the use is non-commercial. See: http://creativecommons.org/licenses/by-nc/4.0/
Statistics from Altmetric.com
Background
Injury is a serious public health issue in Canada. In addition to being the leading cause of death in the first four decades of life, injuries are estimated to cost the Canadian healthcare system $10.7 billion in direct healthcare costs and the Canadian economy $9.1 billion in indirect costs resulting from hospitalisation, disability and premature death.1 Every year, injuries result in approximately 13 677 deaths, 211 000 hospitalisations and 3 million emergency room visits.1 What sets injuries apart from the other leading causes of death in Canada is that they are almost always preventable.
The aim of this study was to explore the relationship between neighbourhood socioeconomic status (NSES) and the rate of adult severe injury in Greater Vancouver using a variety of descriptive statistics and exploratory spatial data analysis methods. More specifically, this study sought to determine whether there was a statistically significant relationship between NSES and the rate of all-cause, unintentional and intentional adult severe injury in Greater Vancouver. If so, the second objective of this study was to determine whether this relationship was spatially consistent or varied from one region to another. Understanding the factors that influence a person's risk for severe injury can help public health organisations develop effective injury prevention programmes and policies. Likewise, knowing what population groups are at greatest risk of severe injury can inform where these programmes and other healthcare services (eg, trauma centres) should be located. Investigating the degree of spatial heterogeneity in the NSES-injury relationship can help to further target these resources by identifying places where the relationship is strongest and thus, where modifying the socioeconomic environment would potentially result in the largest reduction of severe injury.2
Methods
Study region
For the purposes of this study, Greater Vancouver was defined as the Vancouver and Abbotsford census metropolitan areas. This is a largely urban region located within south-western British Columbia, Canada and is home to approximately 2.4 million people.3 Greater Vancouver was chosen for this analysis because it is comprised of a socioeconomically diverse collection of communities. In fact, this region contains some of the most socioeconomically privileged as well as some of the most socioeconomically deprived neighbourhoods in Canada. Vancouver's Downtown Eastside (DTES), for example, is a neighbourhood notorious for its extreme levels of poverty, homelessness, mental illness and drug addiction.4
Data
Rate of severe injury
British Columbia's Coroner's Service records and the British Columbia's Trauma Registry were used to identify all adults that had sustained a severe injury between 1 April 2001 and 31 March 2006. A severe injury was defined as an injury that results in death prior to hospital admission or one that is treated at one of British Columbia's eight trauma centres and given an ISS greater than 12. An adult was considered to be someone 20 years of age or older so that the injury data aligned with the denominator census population groupings used to calculate the rates.
Once identified, the severe injury cases were aggregated by the 2006 census dissemination areas (DAs) using their home residence postal codes and Statistics Canada's Postal Code Conversion File. Next, the crude annual incidence rates of all-cause, unintentional and intentional severe injury per 100 000 person-years was calculated for all DAs within our study region.
Neighbourhood socioeconomic status
NSES was measured at the DA level using area-based indices of material and social deprivation based on the conceptualisation of deprivation proposed by Peter Townsend.5 The social deprivation index is comprised of the following 2006 census variables: the proportion of individuals living alone; the proportion of individuals who are separated, divorced or widowed; and the proportion of single-parent families. The material deprivation index, on the other hand, includes: the proportion of people with no high school diploma; the employment/population ratio; and the average income of adults. We used the composite scores of these indices in our regression models and the quintile ranks in our descriptive analyses. The deprivation quintiles were population weighted so that each quintile contains approximately 20% of the study region's population (figure 1). Therefore, the index enables a comparison and identification of highly deprived areas relative to their corresponding region. A detailed methodology for the creation of the index can be found here.6
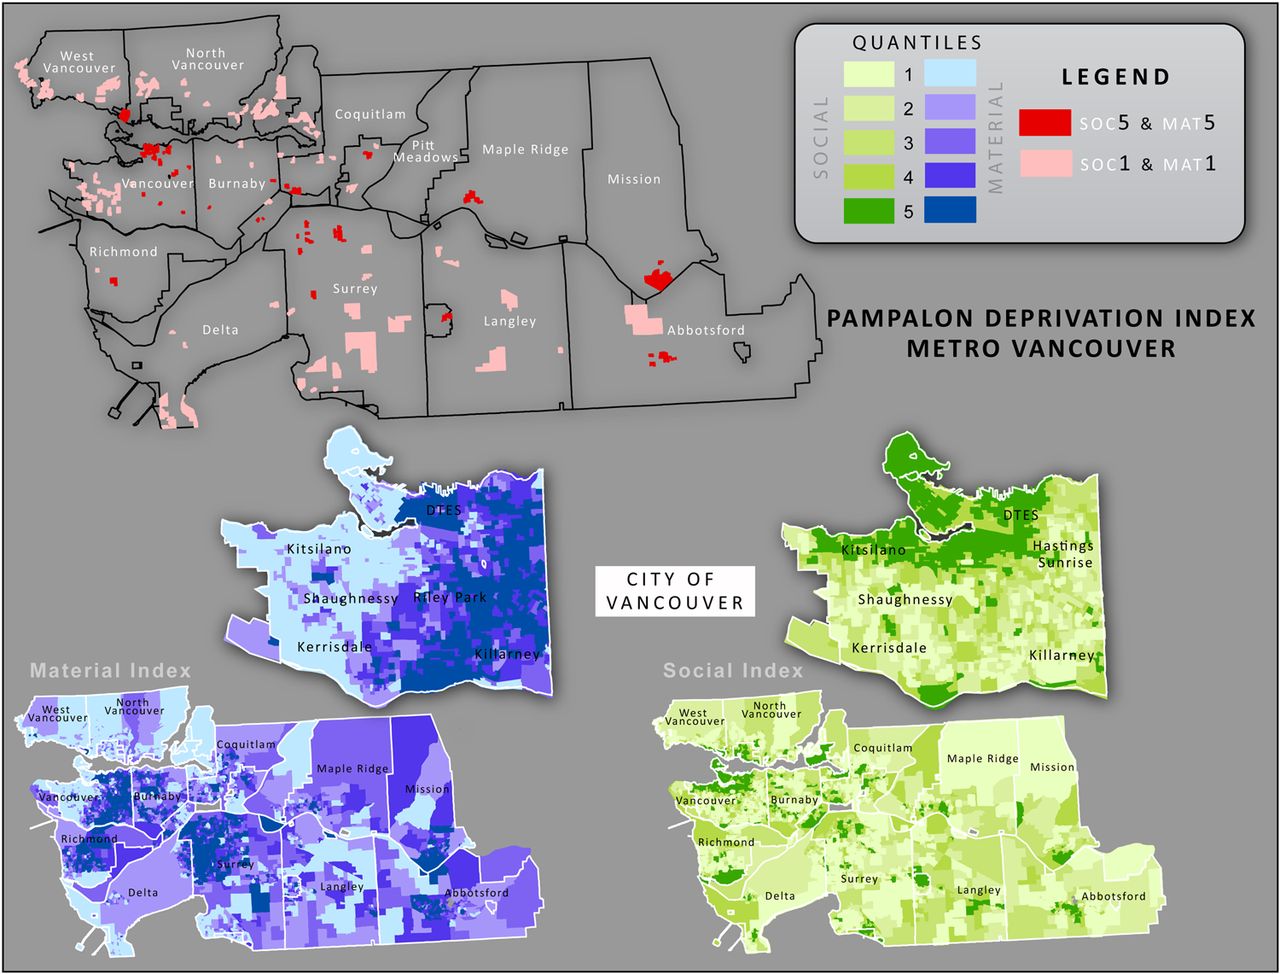
Maps of social deprivation, material deprivation, and social and material deprivation (c) in Greater Vancouver. These maps show the spatial distribution of social deprivation, material deprivation, and social and material deprivation across Greater Vancouver. Each census dissemination area is symbolised based on their quintile rank, with light green and light blue depicting neighbourhoods in the least deprived quintile (Q1) and dark green and dark blue depicting neighbourhoods in the most deprived quintile (Q5). In the map at the top of the figure, only the neighbourhoods that are in the least deprived quintile of both indices (Q1–Q1) and in the most deprived quintile of both indices (Q5–Q5) are highlighted. As shown, there is very little overlap between the spatial distribution of social and material deprivation in Greater Vancouver.
Covariates
To account for the influence of the age and gender structure of neighbourhoods on the rates of severe injury, we included two control variables in our regression analyses: the proportion of the population that was male (%MALE) and the population that was 85 years of age or older (%85+). We chose to control for this age group because it had the highest age-specific severe injury incidence rate and because it had been identified previously as an age group with a significantly higher risk of severe injury in Canada.7
Descriptive statistics and exploratory spatial data analysis
We used the global Moran's I statistic, as implemented in ArcGIS V.10, to determine the degree of global spatial autocorrelation (ie, clustering) present in each data set. We than used the Anselin Local Moran's I statistic, a local measure of spatial autocorrelation, to identify hot spots. A detailed explanation of how the Moran's I works can be found here.8 Next, we calculated the Pearson correlations between the rates of severe injury and our explanatory variables to determine the direction and magnitude of their associations. Lastly, we calculated the crude annual incidence rates of severe injury per 100 000 person-years for each social and material deprivation quintile in Greater Vancouver.
Modelling the NSES-injury relationship
First, an ordinary least squares (OLS) regression was used on each dependent variable (eg, all-cause severe injury rate, intentional severe injury rate and unintentional severe injury rate) to determine which combination of explanatory variables resulted in the final model. Three models were built, one with social deprivation as the explanatory variable, one with material deprivation as the explanatory variable, and the last with social deprivation and material deprivation as the explanatory variables. Then, we added the two control variables to each model to control for the age and gender structures of the neighbourhoods. Once the final model for each dependent variable was identified, we tested the residuals for spatial autocorrelation using the global Moran's I tool.
Next, we used geographically weighted regression (GWR) to explicitly test whether the NSES-injury relationship was spatially consistent or heterogeneous. Unlike traditional regression methods, GWR does not assume that the observations are spatially independent.9 Instead, GWR is based on the assumption that spatial autocorrelation does exist and enables the researcher to objectively measure and visualise how a relationship varies over space.10 A more detailed description of GWR can be found elsewhere.11 ,12
Results
We identified 6636 unique severe injury cases for our analysis. Of these, 4742 (72%) were unintentional, 1704 (26%) were intentional and 190 (3%) had an unknown intentionality. Over our 5 year study period, the annual adult incidence rate of all-cause severe injury was 76 per 100 000 person-years. When broken down by intentionality, the rate of unintentional injuries (54 per 100 000 person-years) was more than double the rate of intentional severe injuries (19 per 100 000 person-years). The median age was 46 years and the highest age-specific incidence rate (228 per 100 000 person-years) was observed in the very elderly (ie, 85 years of age and older) population, which is consistent with the results of other injury surveillance research in Canada.7 ,13 There was also a significant gender gap in the rate of severe injury, with men having an all-cause severe injury incidence rate (115 per 100 000 person-years) almost triple that of women (40 per 100 000 person-years). Interestingly, a gender gap in the incidence rate of all-cause severe injury was observed in every age category, not just the young.
The crude all-cause severe injury incidence rates for each social and material deprivation quintile are shown in figure 2. As shown, the rate of severe injury in the most socially deprived neighbourhoods (101 per 100 000 person-years) was much higher than in the least socially deprived neighbourhoods (60 per 100 000 person-years). Similarly, the neighbourhoods with the greatest material deprivation had a much higher rate of severe injury (96 per 100 000 person-years) than those with the least amount of material deprivation (65 per 100 000 person-years). When the NSES quintiles were considered together (ie, Q1–Q1 vs Q5–Q5) the gap was even more pronounced, with the rate of severe injury almost four times higher in the most deprived neighbourhoods (205 per 100 000 person-years) compared with least deprived neighbourhoods (56 per 100 000 person-years).
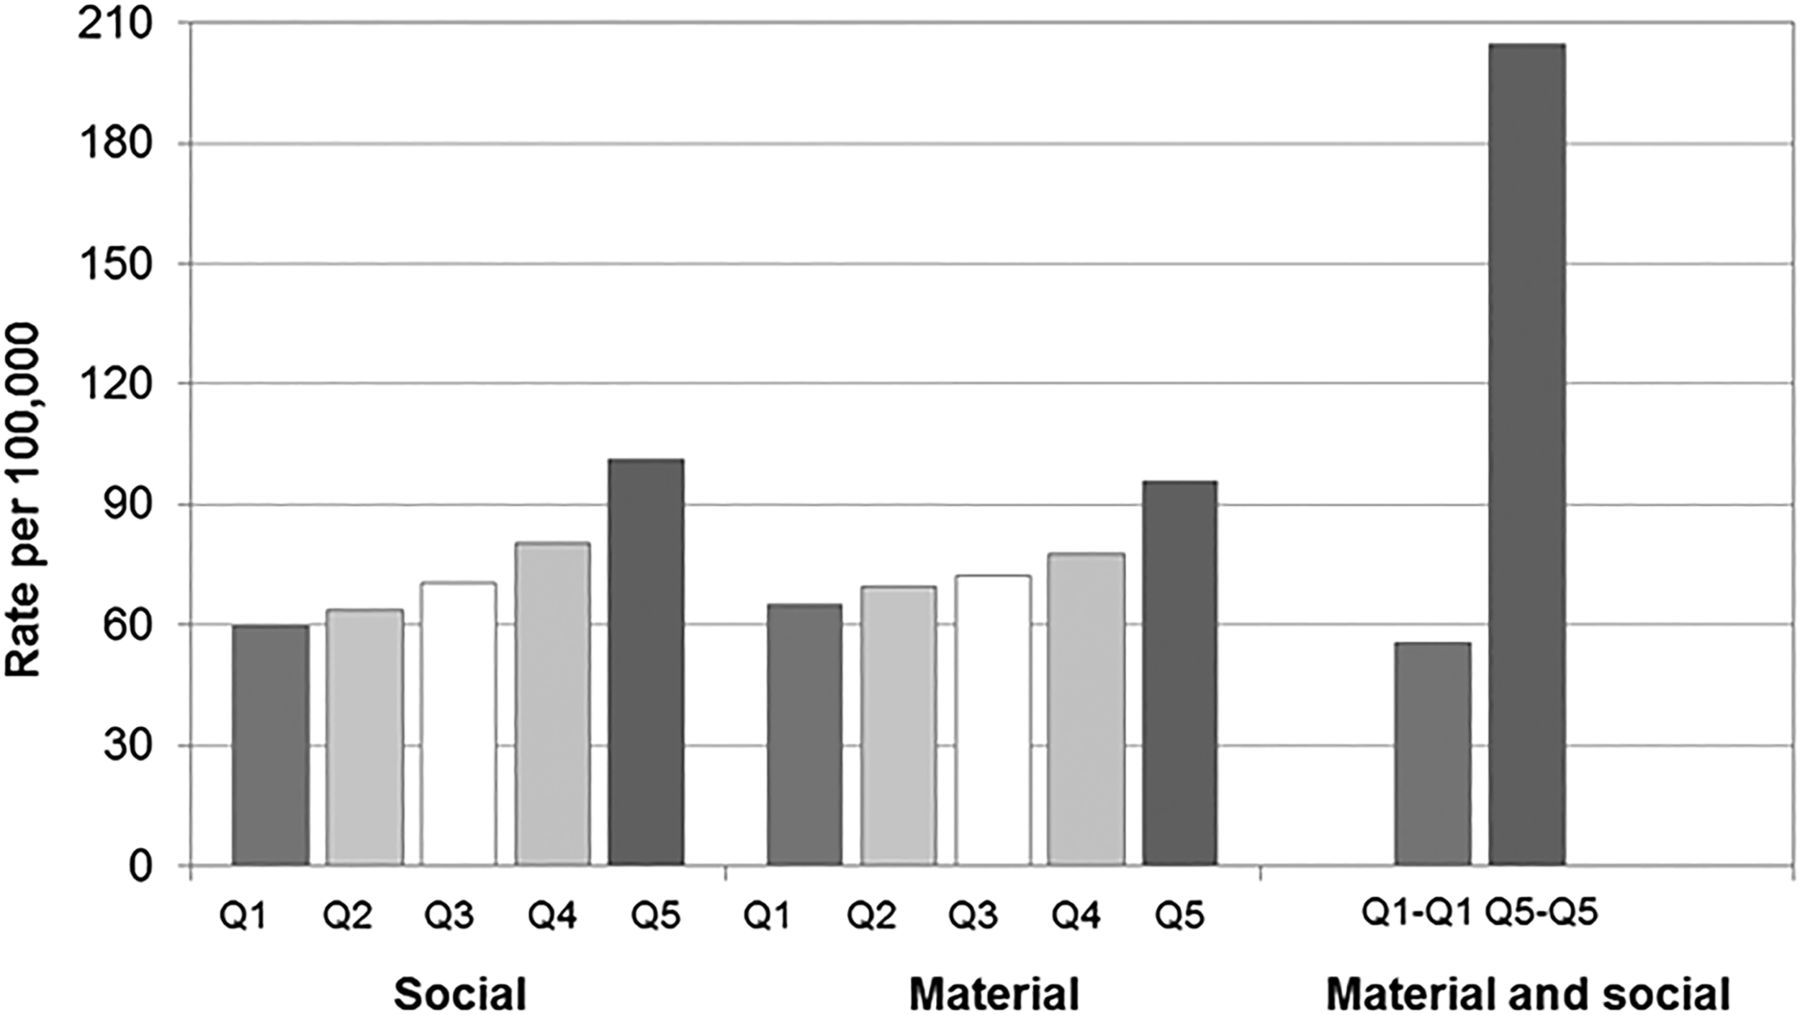
Crude annual incident rates of all-cause severe injury by neighbourhood socio-economic status (NSES) quintiles. The crude annual incidence rate of all-cause severe injury is given for each social and material deprivation quintile. Neighbourhoods in the least deprived social and material deprivation quintiles (Q1-Q1) are also compared with the neighbourhoods in the most deprived social and material deprivation quintiles (Q5-Q5). The dark bars correspond with the least deprived quintiles (Q1) and with the most deprived quintiles (Q5).
Figure 2 also indicates that the rate of severe injury increases with each incremental step down the NSES ladder suggesting that NSES affects a person's risk of severe injury regardless of where they are located along the socioeconomic continuum. However, the largest jump in the crude rate of severe injury was observed between the fourth and fifth quintiles (ie, the second most deprived neighbourhoods and the most deprived neighbourhoods). This suggests that NSES may play a larger role in influencing the rate of severe injury in the most deprived neighbourhoods than at other levels of NSES. When comparing the slopes of the graphs shown in figure 2, it is also evident that social deprivation may have a slightly stronger relationship with the rate of severe injury than material deprivation.
The Pearson correlations between the rates of severe injury and the explanatory variables used in our regression analyses are shown in table 1. These were calculated using SPSS software V.19.0 (SPSS, Chicago, Illinois, USA). The only insignificant association was between the rate of intentional severe injury and the proportion of the population aged 85 years or older (%85+). Thus, this variable was not included in any of the intentional severe injury regression models.
Pearson correlations between the dependent and explanatory variables used in the regression analyses
All of the explanatory and outcome variables exhibited statistically significant positive spatial autocorrelation at the global and local levels. This was not surprising given the spatial patterns that were evident after initially mapping the data sets. These tests of spatial autocorrelation confirm that our observations are not independent and thus, the use of OLS to measure the relationship between our dependent and independent variables may be inappropriate.14
As shown in figure 3, there was a fair amount of overlap between the local clusters of unintentional and intentional severe injury rates in Greater Vancouver.

Clusters of high (HH) and low (LL) rates, unintentional and intentional severe injury. These maps show spatial clusters of high (HH) and low (LL) rates of unintentional and intentional severe injury in Greater Vancouver.
Although each of our initial OLS models were statistically significant, they all had fairly low adjusted R2 values meaning they only explained a small proportion of the variation in the rates of severe injury. However, closer examination of the models shows that each of our initial models was greatly underpredicting the rates of severe injury in and around Vancouver's DTES. Therefore, we created a dummy variable (DTES) to account for this regional variation and added it to the final model for each dependent variable. The addition of this dummy variable significantly improved the adjusted R2 and alkaline information criterion (AICc) values in each of the models, suggesting the relationships between NSES and the rates of severe injury are indeed location dependent.
The OLS models with the highest adjusted R2 for each dependent variable included material and social deprivation as explanatory variables.
The coefficients of the explanatory variables in all the models shown in table 2 were statistically significant and the variance inflation factor for each explanatory variable was less than 1.5, meaning there were no issues of multicollinearity. However, as shown in table 2, the residuals for every OLS model exhibited statistically significant spatial autocorrelation. This indicates that our OLS results may be unreliable because the assumption of residual independence has been violated.
OLS regression models
GWR results
Unlike with our OLS models, the inclusion of the age and gender variables (%MALE and %85+) in our GWR models resulted in significant local multicollinearity. Also, because GWR allows the model parameters to vary over space, the inclusion of the DTES dummy variable was unnecessary.
The results of our GWR analysis are shown in table 3. Because the parameter estimates are allowed to vary over space, the adjusted R2 values produced from GWR are often much higher than stationary regression methods and thus, are best interpreted as relative rather than absolute measures of model performance. Interestingly, the GWR models that performed the best for each dependent variable had social deprivation as the only explanatory variable. Also, the GWR models with the rate of unintentional severe injury as the dependent variable performed slightly better than the models with the rate of intentional severe injury as the dependent variable. This was consistent with the results of our OLS analysis, but conflicted with our Pearson correlation results, both of which measured the strength of these associations at the global level (figure 4).
GWR models

Association between all-cause severe injury and social deprivation. This map shows where the relationship between the incidence rate of all-cause severe injury and social deprivation is the strongest and the weakest. The map also identifies the neighbourhoods where there were clusters of high all-cause severe injury rates and social deprivation coefficient values. In other words, it depicts specific regions within our study area where policies and programmes aimed at reducing the rates of all-cause severe injury by augmenting the social environment would have the greatest benefit.
As shown by their higher adjusted R2 values and the lower AICc values, the GWR models provided a better fit with the observed data than the OLS models (tables 2 and 3). The residuals of the GWR models also exhibited very little or no spatial autocorrelation, meaning their parameter estimates are more reliable than their OLS counterparts (table 3). Furthermore, the condition numbers for the GWR models including social and material deprivation were all far less than 30, meaning there were no issues with local multicollinearity.15
Discussion
Our study identified a statistically significant inverse relationship between two measures of NSES and the rates of all-cause, unintentional and intentional severe injury in Greater Vancouver. In other words, neighbourhoods (ie, DAs) with high social and material deprivation were associated with higher rates of severe injury (figure 4). This supports the findings of a literature review on injury and socioeconomic status conducted by Cubbin et al,16 which found that injuries resulting in a death or hospitalisation had an inverse relationship with individual and area level measures of socioeconomic status. Interestingly, our results were mixed as to whether NSES had a stronger relationship with the rates of intentional or unintentional severe injuries. However, our analysis did find that social deprivation explained slightly more of the variation in the rates of severe injury than material deprivation. This suggests that the sociocultural milieu of a neighbourhood plays at least an equally important role as material deprivation in determining the risk of severe injury in Greater Vancouver. Although much of the literature investigating the relationship between injury and socioeconomic status has used material measures of socioeconomic status, the few studies that have used measures related to the social components of socioeconomic status, have also detected an inverse association.17 ,18
In a recent study investigating the relationship between material deprivation and unintentional injury deaths across Canada, the authors found that area level socioeconomic status only played a significant role in determining the risk of injury death in the most deprived neighbourhoods.19 Similarly, the results of our analysis suggest that the relationship between NSES and severe injury is the strongest in the most socioeconomically deprived regions of Greater Vancouver. In fact, given the dramatic improvement in our OLS models after the addition of the dummy variable for Vancouver's DTES, it is plausible that these strong local relationships are the driving force behind the identified relationships at the global level. This highlights the importance of explicitly testing whether or not an identified relationship is stationary, because if it's not, important local variations and local drivers could be overlooked.12
This study has several limitations. First, we had to omit 800 cases of severe injury from our analysis because they lacked sufficient home address information. However, because we used provincial data sets, not all of these cases would have resided within Greater Vancouver. Also, many of these cases were homeless individuals and thus, would likely also be missing from the denominator census population figures used to calculate the rates of severe injury. Nonetheless, the exclusion of these cases from our analysis may have influenced our results. Second, although we attempted to control for potential confounders such as the age and gender structure of the neighbourhoods, the results of our regression analyses may still suffer from omitted variable or residual confounding bias and thus, should be interpreted with caution. Similarly, because we did not control for individual level socioeconomic status, we were unable to infer whether the observed relationship was due to mechanisms working at the individual or neighbourhood levels. Because of this, and due to the cross-sectional nature of the data used and the lack of temporal order between the explanatory and dependent variables, we were unable to infer causality. Also, it is important to note that our results may have been different if we had used another rate smoothing technique or unit of analysis. Likewise, results may have varied if we had used other measures of socioeconomic status, if we had studied a different population or age group, if we had studied injuries with different outcome, or if we had studied a different type of severe injury.16 In addition, our analysis was unable to examine specific causes of injuries, such as motor vehicle collisions or falls, which alone may have had a different relationship with neighbourhood socioeconomic status than when combined. More detailed research will be needed to determine how neighbourhood social deprivation may influence the rate of severe injury and whether it varies by the cause of injury. For example, are persons living alone more likely to suffer from injuries caused by falls because they have nobody around to ask for help when partaking in risky household activities? Or are individuals who are separated, divorced or widowed more likely to incur injuries resulting from self-harm.
Conclusion
This study found statistically significant global as well as local relationships between the rates of all-cause, unintentional and intentional severe injury and two measures of NSES in Greater Vancouver. This suggests that a combination of region-wide and neighbourhood-specific injury prevention programmes and policies may be warranted. However, the strength of the local relationships varied from place to place, with the strongest associations located in the most socioeconomically deprived neighbourhoods of our study region, such as Vancouver's DTES. This variation in the NSES-injury relationship may mean that injury prevention efforts would be more successful in some regions than in others.
What is already known on this subject?
Many studies show that severe injuries resulting in death and hospitalisation typically occur at a higher rate in economically deprived populations.
What this study adds?
Not many studies look at the effect of social deprivation on injury rate. Our analysis did find that social deprivation explained slightly more of the variation in the rates of severe injury than material deprivation. This suggests that the social and cultural structure of a neighbourhood plays a role at least as important as material deprivation in determining the risk of severe injury in Greater Vancouver.
References
Footnotes
Contributors FL helped design the study, conducted the analyses and drafted the manuscript. NS helped revise the manuscript and made substantial contributions to the conception and design of the study. OA contributed to the statistical analysis and interpretation as well the mapping. ABN contributed substantially to conception of the study and helped revise the manuscript.
Funding Canadian Institutes of Health Research. FL was supported in part by a Social Sciences and Humanities Research Council Joseph-Armand Bombardier Canada Graduate Scholarship. OA is supported by a CIHR doctoral fellowship. AN is supported in part by a Canada Research Chair. NS is supported in part by a Michael Smith Foundation for Health Research Scholar Award.
Competing interests None.
Provenance and peer review Not commissioned; externally peer reviewed.