Article Text

Abstract
Objective To evaluate the need for triangulating case-finding tools in patient safety surveillance. This study applied four case-finding tools to error-associated patient safety events to identify and characterise the spectrum of events captured by these tools, using puncture or laceration as an example for in-depth analysis.
Data sources/study setting Retrospective hospital discharge data were collected for calendar year 2005 (n=48 418) from a large, urban medical centre in the USA.
Study design The study design was cross-sectional and used data linkage to identify the cases captured by each of four case-finding tools.
Data collection/extraction methods Three case-finding tools (International Classification of Diseases external (E) and nature (N) of injury codes, Patient Safety Indicators (PSI)) were applied to the administrative discharge data to identify potential patient safety events. The fourth tool was Patient Safety Net, a web-based voluntary patient safety event reporting system.
Results The degree of mutual exclusion among detection methods was substantial. For example, when linking puncture or laceration on unique identifiers, out of 447 potential events, 118 were identical between PSI and E-codes, 152 were identical between N-codes and E-codes and 188 were identical between PSI and N-codes. Only 100 events that were identified by PSI, E-codes and N-codes were identical. Triangulation of multiple tools through data linkage captures potential patient safety events most comprehensively.
Conclusions Existing detection tools target patient safety domains differently, and consequently capture different occurrences, necessitating the integration of data from a combination of tools to fully estimate the total burden.
- Surveillance
- patient safety
- administrative data
- error-reporting
- data linkage
- database
- e-code
- information tech
- public health
- surveillance
Statistics from Altmetric.com
- Surveillance
- patient safety
- administrative data
- error-reporting
- data linkage
- database
- e-code
- information tech
- public health
- surveillance
Background
In March 2000, the Institute of Medicine released its seminal public health report, ‘To Err is Human: Building a Safer Health Care System’, citing an annual estimate of 44 000–98 000 deaths in the USA due to medical errors.1 Debate ensued about the estimates, and the argument as to how many events occur annually has yet to be resolved.2 3 The Institute of Medicine report provided the first US medical error mortality estimates, but a surveillance system to consistently capture the full spectrum of patient safety events has not been developed.
A surveillance approach to patient safety is visualised (figure 1). Medical injuries are united with medical errors under the umbrella of surveillance, allowing a more thorough description of the burden of patient safety events. Different case-finding tools have evolved to identify and measure patient safety events, and the role of each can be seen (table 1).

Conceptual diagram of patient safety event classifications with relevant data sources and case-finding tools.
Strengths and weaknesses of case-finding tools
Medical record coding
Administrative data from inpatient hospital discharges capture injuries not associated with error and error-associated injuries. Within hospitals, nosologists review patient charts and assign codes for reimbursement purposes. These codes emanate from the International Classification of Diseases (ICD-9-CM), and relevant codes include ‘nature of injury’ (N-code) and ‘external cause of injury’ (E-code). Researchers have analysed administrative data coding to identify potential patient safety events in Victoria, Australia, and in American state-wide studies in Utah, Missouri and Wisconsin.4–7
Hospital discharge data before 2008 are vulnerable to false positives, resulting from a failure to distinguish conditions present on admission (POA) from those acquired during hospitalisation. In 2008, the Centers for Medicare and Medicaid Services required the assignment of a POA code to every diagnosis, identifying whether or not the condition was acquired in hospital. Houchens et al report that hospitals have been found to over-report POA, probably because this practice reduces the apparent rate of injuries associated with error.8 POA coding has yet to be fully validated.
Administrative data may have limited usefulness owing to a lack of clinical detail or contextual information, variability in coding across providers, incentives for ‘upcoding’ or ‘downcoding’ and inaccuracy. Iezzoni states that ‘reimbursement and reporting incentives can significantly shift coding practices.’9 Administrative data are nonetheless critical, because they are routinely collected, easily acquired and standardised for international comparison.
The patient safety indicators
The Patient Safety Indicators (PSI) are an administrative data algorithm, developed by the Agency for Healthcare Research and Quality (AHRQ) as screening indicators for patient safety case-finding and performance improvement at the provider and system level in hospitals.10 The PSI algorithm uses variables such as ICD-9-CM coded diagnoses and procedures, age, gender, admission source and discharge status to reflect preventable injury exposure more precisely. The principal difference between PSI and E- and N-codes is that PSI target only 20 in-hospital error-associated injuries, restricting numerators and denominators solely to events deemed preventable, by excluding patients whose pre-existing conditions would probably lead to PSI events regardless of error. There is a small amount of overlap between the ICD-9-CM codes used in the PSI categories and the adverse event range of N- and E-codes used in this study: eight use a few N-codes for adverse events (PSI 4, 7, 9, 10, 13, 15, 16) and five use a limited number of E-codes (postoperative hip fracture, birth trauma, foreign body, transfusion reactions and puncture/laceration).11 A number of PSI have been found to incorporate false positives contained in the administrative data owing to the inclusion of pre-existing conditions. 12 13 With respect to their narrowly defined outcomes, PSI have been found to have high specificity, moderate sensitivity and moderate predictive positive value, though these metrics vary considerably among the different PSI.11 14
Voluntary error reporting
Voluntary error reporting captures a vast spectrum of patient safety events.15 Low reporting rates are the norm, and comparisons with chart review have found that voluntary reports identified only 1.5% of adverse events and 6% of adverse drug events. The small, non-random fraction of incidents that is reported cannot be used to establish a numerator when calculating error rates or broad estimates.16
Study goal
Our objective was to examine the extent to which a fuller spectrum of error-associated injuries might be identified using four case-finding tools (E-codes, N-codes, PSI and Patient Safety Net (PSN)). We hypothesised that because each case-finding tool is differently designed and targeted, there would be minimal overlap in events identified by each tool. In so far as case-finding tools did not identify the same events, triangulation would be needed to achieve more comprehensive surveillance. We define triangulation as the use of data linkage to integrate the different results produced by applying multiple case-finding tools to the same patient cohort, using unique identifiers to remove duplicate events. We conducted a more in-depth investigation of puncture/laceration as a case study.
Study design
The study design was cross-sectional and used retrospective data. The setting was a large, urban medical centre. In 2005, the hospital had approximately 1900 total beds and 48 000 discharges. This study used two data sources: the hospital's inpatient discharge data for 2005 and the voluntary error-reporting system for the 2005 calendar year, the first whole year during which the voluntary error-reporting system was operational at the medical centre. All study activities were approved by the institutional review board at the investigators' institution and HIPAA (Health Information Portability and Accountability Act) approval was given by the participating hospital.
Case finding tools
External cause and nature of injury codes
The hospital's discharge data contain 15 diagnosis fields. The N-code and E-code criteria were chosen from the ICD-9-CM categories for adverse events (online supplementary appendix). This study grouped potential adverse events according to the following E-code categories: ‘Misadventures to patient during surgical and medical care’ (E870–E876), ‘Surgical and medical procedures as the cause of abnormal reaction of patients or later complication, without mention of misadventure at the time of procedure’ (E878–E879) and ‘Drugs, medicinal and biological substances causing adverse effects in therapeutic use’ (E930–E949). We included E930–E949 because there is evidence to suggest that a significant percentage of adverse drug events are due to medical errors which can be prevented through improvements in hospital systems.17 We used E850–E858 ‘Accidental poisoning by drugs, medical substances and biological substances’ because this range included further opportunities to capture errors in drug administration. Finally, we included N-codes in the range of 960–979 ‘Poisonings by drugs, medicinal and biological substances’, 995 ‘Certain adverse effects not elsewhere classified’ and 996–999 ‘Complications of surgical and medical care not elsewhere classified’. We used these codes exactly as they appeared in the data because we were examining them as they would be used for surveillance purposes, rather than conducting a validation study.
Patient Safety Indicators
AHRQ's publicly available Windows QI software (version 3.0) was applied to the hospital's administrative discharge data.10 The algorithm assigned one of the 20 PSI categories to each discharge that met the criteria for a potential patient safety event.
Patient Safety Net
Patient Safety Net version 3.0 (PSN) is a voluntary, electronic error-reporting tool developed by the University HealthSystems Consortium (https://www.uhc.edu/11851.htm). Providers enter events into a web-based computer system through which each error is classified by event type and scored to indicate the extent of harm to the patient (A–I: A=unsafe conditions, I=death). Cases were selected that had a harm score of ‘C’ or higher, indicating that an event had reached the patient.
Methods
Given the variable sensitivity and specificity of our case-finding tools, and because our study design did not include chart review, we do not refer to patient safety events in our study, but rather to potential patient safety events. In order to generate patient-level summary statistics, a dichotomous variable was created for each of the four case identification criteria within a patient encounter: any discharge identified as having a potential patient safety event was assigned a numerical value of ‘1’. Non-events were given a value of ‘0’. These tabulations were not based on the first detection of an event by only one case-finding tool, but rather included any discharge as having an event if it was detected by PSN, PSI, N-code or E-code. Data were managed in Microsoft Access. The study employed the STATA software package (Stata 8, StataCorp LP) to perform all analyses.
Differences between potential events and non-events were summarised by age, length of stay, charges, discharge disposition, gender and complexity. Complexity was assessed through the APRDRG Patient Complexity Level (3M APRDRG grouping software, Ver 12). (http://www.hcup-us.ahrq.gov) Each patient was assigned an APRDRG value: 1 (low) to 4 (high). For the analysis, APRDRG complexity was dichotomised into high (3 or 4) and low (1 or 2) categories.
To account for similarities among categories in the different case identification tools, a crosswalk was created showing agreement of categories. For example, E-code 870, ‘accidental cut, puncture, perforation, or haemorrhage during medical care’ (hereafter referred to as ‘puncture/laceration’), was determined to identify the same injury mechanism as PSI 15, ‘accidental puncture/laceration’. Of the 20 PSI categories, only three types of patient safety events had classifications in each of the other three case-finding tools: foreign body, transfusion reactions and puncture/laceration. As there were only three outcomes that could potentially be captured by all four case-finding tools, we examined additional patient safety outcomes from among PSN's event-type categories with classifications in two or more case-finding tools (table 2). We chose PSN as the template for comparison because PSN's categories are the most comprehensive, and include patient safety events of high interest, such as falls and medication errors.
Crosswalk of all case-finding criteria showing overlapping cases
In order to ascertain the number of identical events captured by multiple case-finding tools (overlap), data linkage was conducted. Potential events were linked on their encounter number for the hospital admission. Medical record number, name and demographic data were used to ensure valid data linkage. Total event counts from each case-finding tool were tabulated, and the overlap was identified.
For our case study of puncture/laceration, we took an additional step developed by Gallagher et al11 to eliminate those cases in which puncture/laceration was POA. To achieve this, we removed events in which the patient had puncture/laceration as both the primary and secondary diagnosis. Since chart review was outside the scope of our study, this additional filtering process was an important validation method, an approach also used in a comparable study by Naessens et al in 2009.18
Results
During the 2005 calendar year, 48 418 discharges were recorded. Consistent with previous findings, inpatient encounters flagged by at least one case-finding tool were more likely to have higher average total charges and higher average lengths of stay.19–21 Patients who had potential patient safety events were older and had higher levels of complexity. Some of the case-finding tools detected the same event, therefore an overestimate of patient safety events is presented (40%, table 3). For example, 78% of events detected by N-codes and E-codes are for the same event. De-duplication was performed only on the subset of the events in the crosswalk (table 2).
Summary statistics of patients
A summary of case-finding results is provided (table 4). The hospital's overall E-coding rate was 84%, indicating the percentage of discharges in which an E-code was assigned given that an N-code (ICD-9-CM 800-999) also appeared in the diagnostic string. Detailed tabulations of all events detected by each case-finding tool are available (online appendix).
Summary of case-finding results
The number of potential patient safety events flagged by each of the case-finding tools indicated that minimal overlap was found after data linkage (table 2). Puncture/laceration provides an example. Applying the procedure of Gallagher et al eliminated 13 out of 205 events identified by E-codes, and 16 out of 321 events that were identified by N-codes (10 of these were the same events, identified by both E and N-codes). The total number of puncture/lacerations was thus reduced from 476 to 447, a 6% reduction, which is comparable to the 5% reduction found by Gallagher et al.11
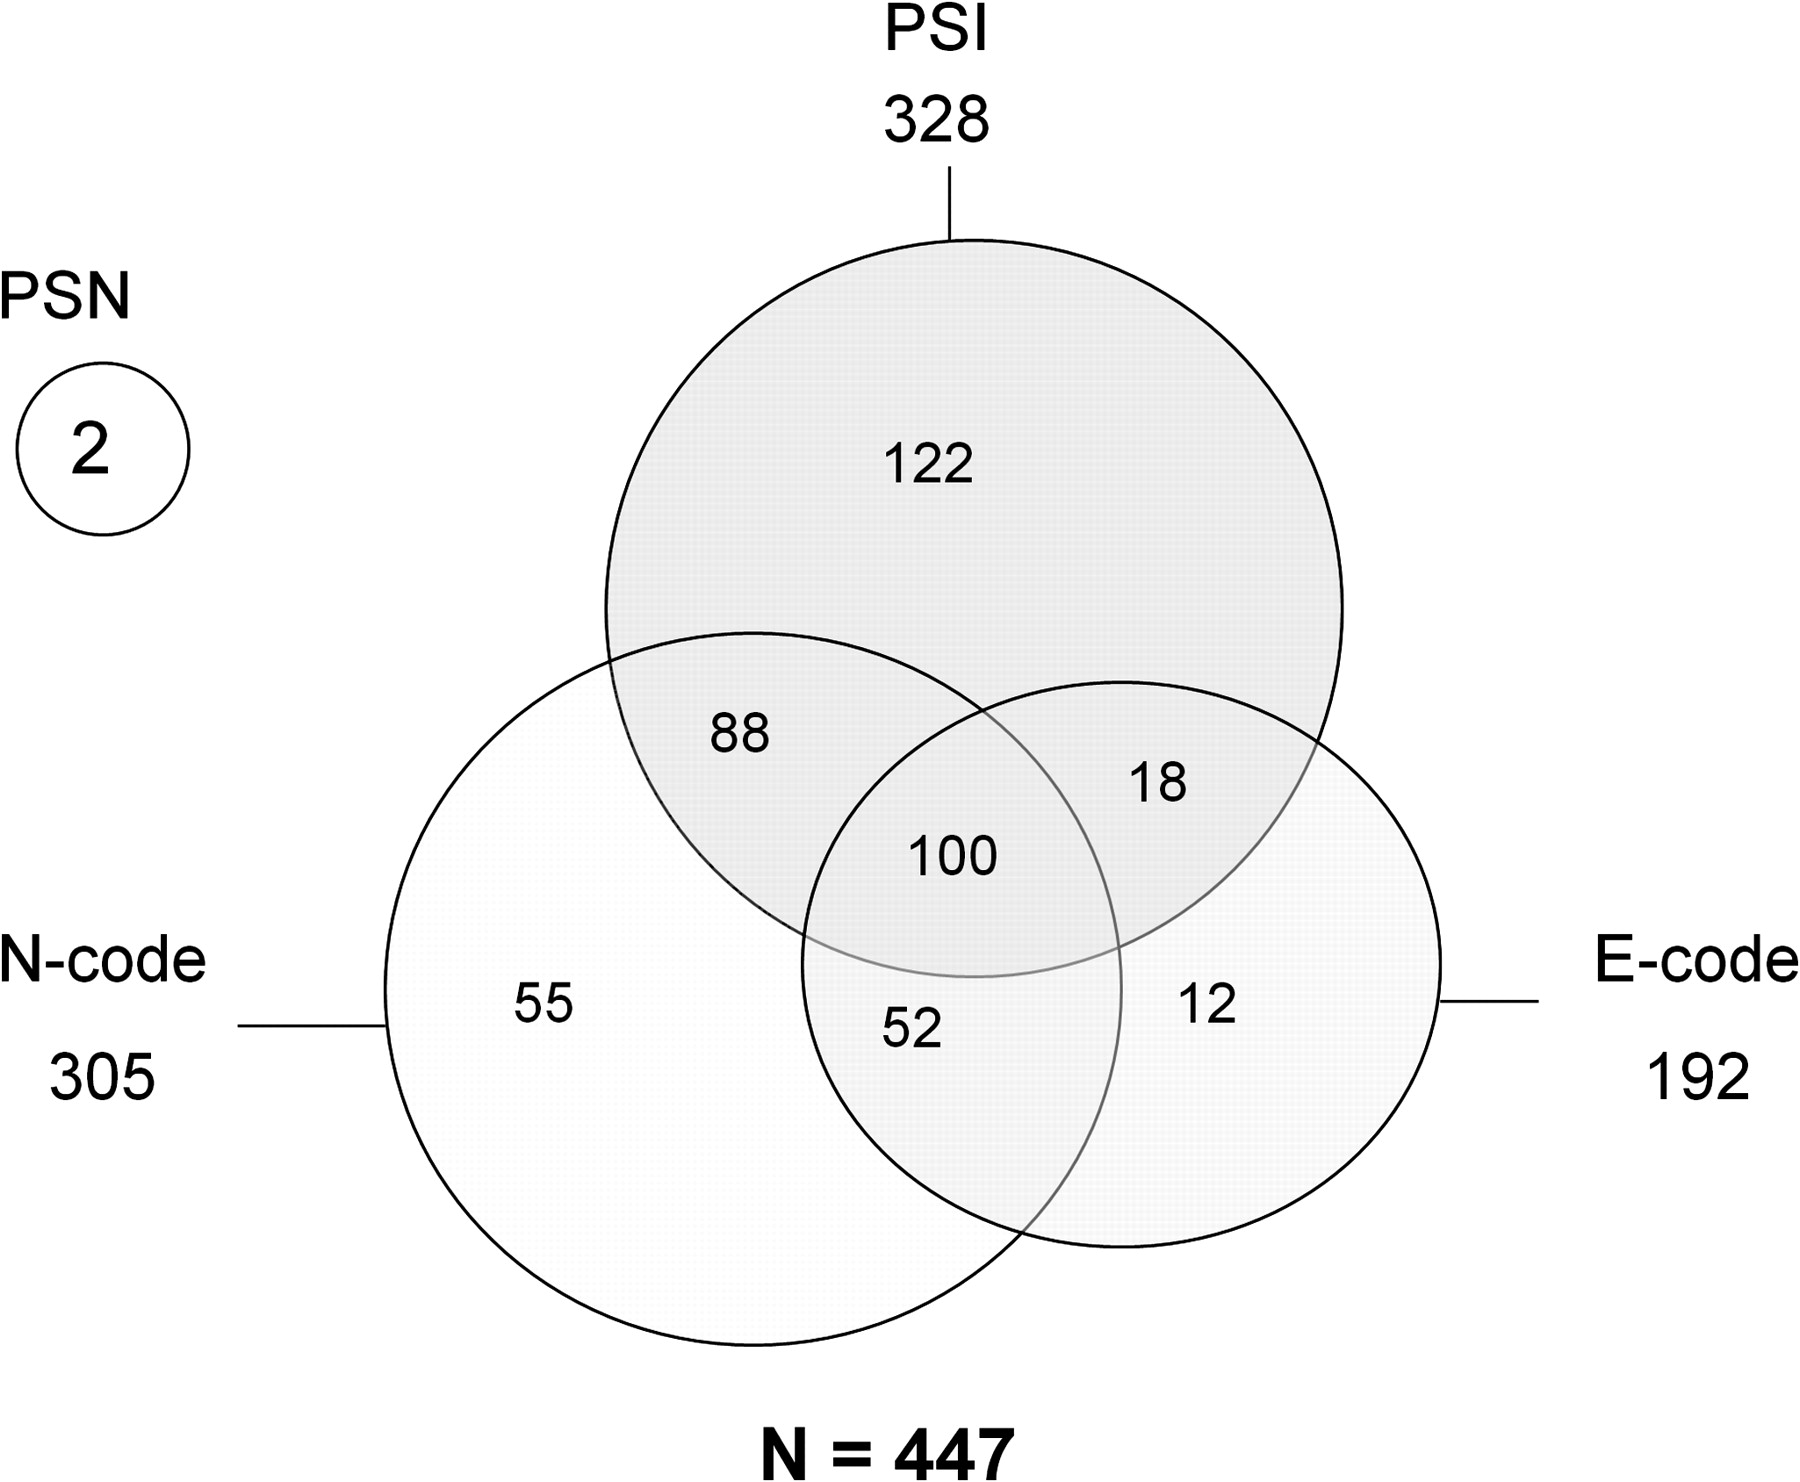
In total, PSI detected 328 potential puncture/laceration events, N-codes detected 305, E-codes detected 192 and PSN detected two (figure 2). When linking puncture/laceration on unique identifiers, out of 447 potential events, 118 were identical between PSI and E-codes, 152 were identical between N-codes and E-codes and 188 were identical between PSI and N-codes. Only 100 events that were identified by PSI, E-codes and N-codes were identical. The two potential events detected by PSN were not among these 100.

Overlap of potential cases of puncture or laceration identified by four event detection tools. E-codes, external cause of injury; N-codes, nature of injury; PSI, Patient Safety Indicators; PSN, Patient Safety Net.
Discussion
This study investigated four tools for detecting potential patient safety events, identified the overlap among them and ascertained that multiple data sources and case-finding tools were necessary to maximise potential patient safety event surveillance. The example of puncture/laceration is illuminating. Out of a total of 447 potential events, there was an overlap of just 22% identified by three of the four methods (PSI, E-codes and N-codes), with two entirely distinct potential events identified by the fourth method, PSN.
Although it was not possible to conduct chart review, validation studies of the various case-finding tools give us confidence that the strong majority of the potential puncture/laceration events were appropriately identified. Gallagher's validation study of the puncture/laceration PSI conducted in 2005 found that 88.5% of cases identified were appropriate for quality-of-care investigation.11 Similarly, Houchens et al found that the puncture/laceration PSI contained only 13% false positives that were POA, establishing this PSI's positive predictive value at 87%.8 In a 2009 report, Romano described even stronger performance by the puncture/laceration PSI, with 91% positive predictive value, and only 2% of false positives due to the injury being POA.22 The large percentage of hospital discharges flagged as potential patient safety events by E- and N-codes reflects the fact that these codes identify medical injuries reasonably well, but are less effective at distinguishing whether or not an injury is associated with medical error. A 1997 study in Victoria, Australia, found that E-codes could detect 65% of all adverse events identified by the chart review method.7 Similarly, a 2005 study in Wisconsin found that screening criteria based on E- and N-codes demonstrated 59.9% sensitivity and 97.4% specificity compared with medical record review.4 E- and N-code ranges were assigned to the most appropriate domain of our surveillance model, but many of these codes may or may not signal a medical error in any given case (figure 1). More definitive attributions of error must ultimately be made through investigation of individual cases, or through creation of new code ranges in the ICD-9-CM for medical misadventures.
This study is one of a small number to combine and compare the results of four or more detection tools applied to multiple linked datasets, and our findings are consistent with recent research showing the need to use more than one approach in patient safety surveillance.4 18 23
The small amount of overlap among the four tools reflects the fact that each has different strengths and targets different occurrences. No case-finding tool is ‘better’ than another. Rather, one must understand the specific nature and utility of each tool. Owing to the variability in sensitivity and specificity of E- and N-coding, neither administrative data nor PSI should be used to compare the performance of different hospitals, though these data are extremely useful for internal quality assurance and improvement. By contrast, public health surveillance does not involve efforts to assign blame, or otherwise make individual institutions accountable for apparent gaps in patient safety. Public health surveillance is conducted from a population-based perspective and therefore does not require the level of accuracy that might be desired by clinicians. As Halperin and Baker point out, ‘a surveillance system that does not have high sensitivity can still be useful in monitoring trends, as long as the sensitivity remains reasonably constant.’24
Our results highlight the importance of including unique identifiers in surveillance data. Without them, discovering the degree of overlap would have been impossible. This is important because policy discussions of mandatory versus voluntary reporting of patient safety events have largely decided on submission of de-identified data, addressing legitimate privacy concerns. The absence of identifiers may limit the precision of national surveillance estimates.
Our study might have been strengthened by using chart review to verify the sensitivity and specificity of the four case-finding tools, but limited resources made such review prohibitive. Further validation of each tool is an important focus for future research. In addition, we applied our triangulation method to only one hospital. Future studies should consider this method with a larger sample of hospitals. Finally, advanced statistical methods to generate national patient safety event estimates must be developed.
It is well known that E-coding is not universal and its specificity is variable in the USA, limiting the generalisability of our findings.25 There would be substantial public health benefit to regulatory change requiring uniform E-coding nationwide.
Conclusion
This study applies four different patient safety case-finding tools to multiple linked datasets. Even within the single domain of error-associated injuries analysed in this study, triangulation of multiple tools was needed to capture potential patient safety events more completely and, by eliminating duplication, more accurately. The case-finding tools used in this study are, to varying degrees, readily available: administrative data are standardised internationally, the PSI software for the SAS and Windows environment is available free of charge through the AHRQ website26 and may be applied to any administrative dataset, and voluntary error-reporting systems, although they require some investment, can be set up by any hospital, healthcare network or national government. Our triangulation methodology may be applied in any country that uses these case-finding tools.
Triangulation through data linkage is a realistic trade-off between an ideal involving an unsustainable burden (chart review), and the acceptance of imperfect, but readily available data. Patient safety surveillance systems should be housed in a governmental institution providing affordable, easy access to the data, the analysis of which should produce new interventions. Comprehensive surveillance should provide the basis for optimal policy development and research funding, interventions and benchmarking to ensure we are making progress in improving patient safety.
What is already known on this subject
Error-associated medical injuries are estimated to cause 44 000–98 000 deaths per year in the USA.
There is no existing surveillance system for medical injuries.
Various case-finding tools exist, each providing insight into different aspects of the patient safety problem, but no coordination exists among them, and the resulting data are not integrated.
What this study adds
This study combines and compares the results of multiple existing patient safety event detection tools applied to multiple linked datasets. Only a small amount of overlap was found, demonstrating the need for triangulation of data from different case-finding tools.
A surveillance approach offers a more comprehensive design for the detection of patient safety events for public health assessment, policy development and evaluation.
For research purposes, our results highlight the importance of including unique identifiers in surveillance data.
References
Supplementary materials
Web Only Data
Files in this Data Supplement:
Web Only Data
Files in this Data Supplement:
Web Only Data
Files in this Data Supplement:
IP editor Brian Johnson talks to Jennifer Taylor about the paper in the IP podcast
Footnotes
Funding This research was supported (in part) by funding from the NIOSH Education and Research Center for Occupational Safety and Health at the Johns Hopkins Bloomberg School of Public Health—a doctoral training program (#T42OH00842428).
Competing interests None.
Ethics approval This study was conducted with the approval of the Johns Hopkins Bloomberg School of Public Health IRB and Johns Hopkins Hospital.
Provenance and peer review Not commissioned; externally peer reviewed.