Article Text

Abstract
Objective: To demonstrate the effect of including both principal and secondary injuries in the calculation of national estimates of non-fatal motor vehicle-related injury, using the National Electronic Injury Surveillance System–All Injury Program (NEISS–AIP).
Methods: The setting was a stratified sample of 15 US hospital emergency departments selected among 50 NEISS–AIP hospitals which agreed to participate in the study. Non-fatal injury data from a special study of the 2004 NEISS–AIP were analysed which allowed up to five injuries to be coded per case. National estimates of number and rate of injuries for 2004 were calculated, first using principal injuries alone, then by including principal and secondary injuries.
Results: An estimated 4 833 626 principal and secondary injuries were sustained by the estimated 2 893 782 motor vehicle occupants involved in a crash and treated in US hospital emergency departments (EDs) in 2004. This represents a 67% increase in the total number of injuries compared with an estimate of principal injury alone. Incidence of contusions/abrasions and lower trunk injuries rose most steeply among broad injury types, and whiplash injury rose 18% in number and rate. A significantly lower percentage of cases with a single listed injury were hospitalised (5%) compared with those who sustained multiple injuries (8%).
Conclusions: Based on an analysis of NEISS–AIP special study data, the inclusion of both principal and secondary injuries in national estimates of motor vehicle-related occupant injury would provide a more comprehensive report of non-fatal injuries treated in US hospital EDs. Other countries with ED-based surveillance systems could consider reporting multiple injuries when assessing injury count associated with motor vehicle trauma requiring ED care.
Statistics from Altmetric.com
Motor vehicle-related trauma is the leading cause of injury-related death and the fourth leading cause of non-fatal injury treated in hospital emergency departments (EDs) in the United States.12 This high degree of mortality and morbidity is partly attributable to the powerful kinetic forces often involved in motor vehicle crashes, in which multiple serious injuries to a crash victim can often occur. Each separate injury suffered by a crash victim requires time, money and ED resources for its care, and each therefore should contribute to the overall count of injury attributable to motor vehicle-related trauma. Not all injury surveillance systems, however, recognise multiple injuries per person when calculating injury estimates. In many systems, a principal diagnosis of injury serves not only as the key inclusion criterion, but also as the sole injury utilised when calculating national estimates of total injury.3 This method could lead to a substantial underestimate of injury count in terms of total treated injuries, particularly when applied to the study of motor vehicle-related trauma. An example of such a system is the National Electronic Injury Surveillance System–All Injury Program, or NEISS–AIP. This surveillance system has been used extensively to describe national estimates of non-fatal injuries in the United States for all causes and has provided timely information about emerging injuries related to consumer products.245 Although NEISS–AIP collects valuable information on the demographics, principal injury and disposition of incident cases of injury requiring emergency care around the country, secondary injuries are recorded only in a short narrative section, at the discretion of the coder, and remain uncoded.6 The purpose of this study was to examine the effect of routinely coding secondary injuries in the NEISS–AIP for inclusion into national estimates of injury. This could allow not only for a more comprehensive portrayal of injury count, but also for a more accurate portrayal of national injury rates due to the inclusion of incident injuries identified among secondary diagnoses. The value of coding multiple injuries is then further demonstrated by distinguishing persons with multiple injuries from those with an isolated injury, and demonstrating how these two types of injury cases differ by ED discharge disposition.
Methods
NEISS–AIP database
The NEISS–AIP, maintained and operated by the US Consumer Product Safety Commission (CPSC), is a nationwide probability sample of 63 hospitals used to monitor injury-related visits at US hospital EDs.7 Participating hospitals are selected from five strata, four of which are based on size (total ED visits) and one other which represents children’s hospitals. The sample is nationally representative, and cases are weighted by the inverse probability of selection, so that national estimates of injury can be calculated, based on initial visits for a given cause of injury. Data routinely collected via the NEISS–AIP include the basic demographics of the case (including age, sex and race), information about the cause of the injury (including the event, location, intent, mechanism and consumer product involved), and medical information abstracted from the ED chart, such as the principal diagnosis, principal body region affected, and ED discharge disposition. CPSC classifies injury using a unique system that separately codes diagnosis (eg, fracture) and body region (eg, head).6
Special study data collection and subject selection (1 January 2004–31 December 2004)
A stratified random sample of 15 hospitals (three per stratum) was selected from the 50 NEISS–AIP hospitals which agreed to participate in the special study. In addition to routinely collected data, a special screen in the data acquisition software required a NEISS coder to record up to four secondary injury diagnoses per person (and their respective affected body regions), and to order these injury diagnoses as listed by the treating physician. The special screen was triggered when the injured person was identified as a “motor vehicle occupant” involved in a collision, rollover, crash or some other event involving another vehicle or object.6 The type of motor vehicle involved in the crash could include cars, pickup trucks, vans, heavy transport vehicles, buses and SUVs, but did not include small recreational vehicles, such as motorcycles, ATVs, snowmobiles and go-carts. This study was approved by CDC’s Institutional Review Board.
Classification of injuries
Each separate injury was assigned a number by its listing in the ED record (first listed injury through fifth listed injury), and these were then grouped into two categories: principal injuries (first-listed injury), and secondary injuries (second through fifth-listed injuries). Injury count was then calculated in two ways: first by summing all principal injuries (total principal injuries), and second by summing principal and secondary injuries (total multiple injuries).
Calculation of injury rates
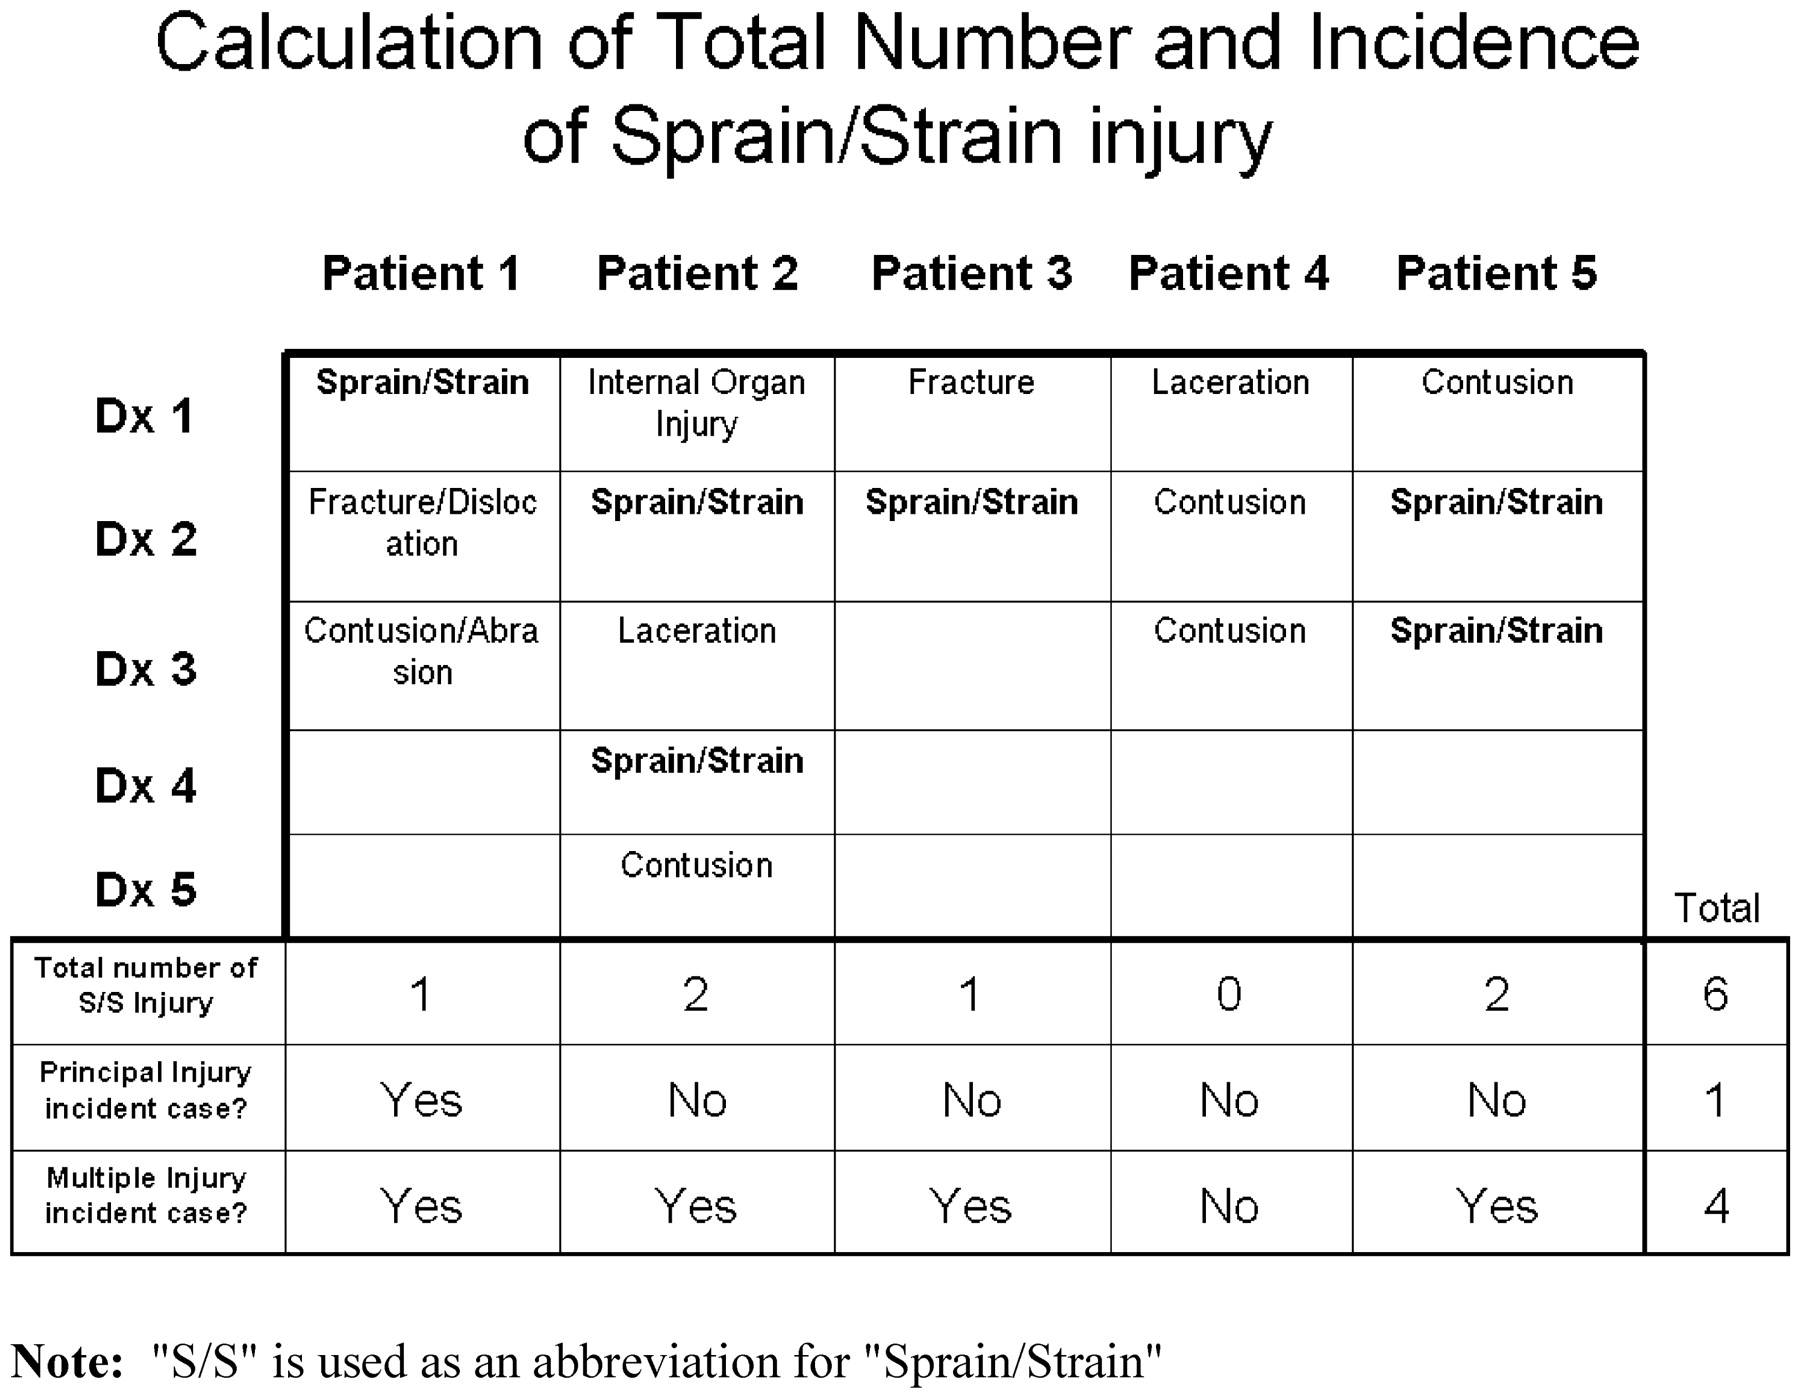
To produce stable estimates, NEISS–AIP injury categories for diagnosis and body region were combined into five broad diagnosis categories and seven broad body region categories. For each category, an incident case (person) was identified in two ways: first by whether a given injury type had been listed as the principal injury for that person, and second by whether a given injury type had been listed among any of the five possibly listed injuries for that person. Due to the broad injury categories used in this study, a person could often have more than one injury of a certain type listed among their multiple injuries. For example, a sprain/strain injury could occur as both the first-listed and third-listed injury treated in the ED for a given person. As fig 1 shows, such a person would contribute two sprain/strain injuries to the overall count of sprain/strain injury, but would contribute only one case of sprain/strain injury to the incidence of sprain/strain.
Illustrative example distinguishing total injuries, incident cases (persons) using principal injury alone, and incident cases (persons) using multiple injuries, for the diagnosis of sprain/strain.
Definitions of whiplash and traumatic brain injury
Sprain/strain injuries to the neck were used to define whiplash injuries, while traumatic brain injury (TBI) was defined by combining concussions and internal organ injuries of the head. Although these NEISS–AIP codes can serve only as a proxy for a more specific diagnosis, this technique has been used in past studies to identify and study whiplash injury and TBI within NEISS–AIP datasets.89
Calculation of national estimates
National estimates were generated using SAS and SUDAAN software. Each injury was assigned its own weight, based on the inverse probability of the selection of the hospital at which the injured person was treated. National estimates were calculated by summing the weights for each separate injury, and 95% CIs around estimates were calculated using a direct variance estimation procedure that accounted for the sample weights and the complex sample design.10 For annual rate calculations per 100 000 persons, denominator data were obtained from US Census Bureau bridged-race population estimates for 2004.11
To verify that the sample of 15 hospitals from this special study could produce national estimates comparable to the full NEISS sample of 63 hospitals, demographic characteristics of the two samples were compared and found to be similar. As expected, the coefficients of variation for national estimates derived from this pilot study were greater than those for the full 2004 dataset. Most national estimates and rates presented in the tables had coefficients of variation (CV) less than 30 and were considered to be reliable. However, a few estimates and rates had CVs just above 30 and therefore are reported as possibly unreliable, likely due to the relatively small number of NEISS hospitals participating in this special study.
Comparison of persons with multiple versus isolated injury
A person treated for “multiple injuries” was defined as one in which two or more injuries were listed in the ED record, while those with only one listed injury were labelled as having an “isolated injury”. These two categories were compared by sex, age and disposition. χ2 Tests were applied to test for statistically significant differences between proportions of the two groups.12
Results
Table 1 compares the total number of principal injuries to the total number of multiple injuries, with results stratified by diagnosis and body region. Total injury count attributable to motor vehicle-related trauma increased 67% when calculated as the sum of all listed injuries in the ED record. Contusions/abrasions and lacerations/avulsions were associated with the greatest increases in count (110% and 62%), while fractures/dislocations rose 39%. Extremity injuries and lower trunk injuries accounted for the greatest increases among body regions (122% and 113%), while the head and neck showed the smallest increases in count (36% and 21%). In terms of more specific injuries, an 18% increase in whiplash injury count was identified, as well as an 11% increase in the unweighted number of TBI injuries. (Due to the small sample size, the increase for TBI injuries could only be calculated using unweighted numbers.)
Estimated number of non-fatal motor vehicle occupant injuries and percentage increase using principal versus multiple injuries per case, United States, 2004
Table 2 presents diagnosis-specific and body-region specific injury rates. Contusions/abrasions showed the greatest increase in rate ratio by diagnoses (rate ratio = 1.61), while the lower trunk region showed the greatest increase by body region (rate ratio = 2.08). The rate for whiplash injury rose by a factor of 1.18.
Unweighted and weighted number of incident cases of injury (persons) and associated rates; comparison using principal and multiple injury incident cases
Table 3 illustrates the distribution of individual injuries by their listing in the ED record. It shows that the first two listed injuries account for nearly 90% of total injury count, with the second-listed injury alone accounting for 70% of the total secondary injury count (ie, 2nd through 5th listed injuries).
Distribution of injuries by their listing in the emergency department record
In table 4, persons with multiple injury are compared to those with isolated injury by sex, age and disposition. Nearly half (46%) of all persons in the database were treated in the ED for at least two injuries. The larger proportion of both multiple injury patients and isolated injury patients were female. Those in the 0–14 year-old age group were twice as likely to be treated for isolated injuries as for multiple injuries. Persons with multiple injuries were significantly more likely to be hospitalised than those with isolated injuries (8% vs 5% hospitalisation percentage, respectively; p<0.001).
Distribution of sex, age and disposition for persons with multiple injury versus isolated injury, 2004
Discussion
We estimate that while 2 893 782 people received ED treatment for non-fatal injuries resulting from motor vehicle-related trauma in the United States in 2004, they sustained a total of 4 833 626 separate injuries. While the NEISS–AIP currently describes ED-treated injury count in terms of the number of persons injured (based on principal injuries alone), this study shows that total ED-treated injury count due to motor vehicle-related trauma would increase 67% by recognising and including up to five treated injuries per person. While this figure still does not represent the complete count of injuries treated in US emergency departments (eg, second visits for the same injury are not included in national estimates), the coding of secondary injuries could provide a more comprehensive picture of the number and range of motor vehicle-related injuries which require emergency care, and impact the rates of injury reported by the NEISS–AIP. This substantial increase in injury count and injury rates could have important implications when studying such issues as the cost of ED care, ED resource allocation, and the time required to treat motor vehicle trauma victims in the ED.
All diagnosis and body region categories incurred substantial increases in total count with the addition of secondary injuries; however, these increases were not evenly distributed to all categories in terms of relative frequency. While the rank order of diagnosis types remained unchanged, the addition of secondary injuries did change the relative frequency of injuries to certain body regions, with extremity and lower trunk injuries rising in relative rank order of frequency. Because the diagnosis categories were very broad, a more specific injury was also chosen for further study. Whiplash has been cited as the single most common non-fatal injury diagnosis listed by ED physicians in the United States.8 While its severity may vary considerably, whiplash is typically considered to be relatively minor in nature, and may often be listed by ED physicians as a secondary injury for crash victims who were treated for multiple injuries in the ED. As a result, whiplash is particularly prone to being underestimated by ED surveillance systems, such as the NEISS–AIP, which include only the principal diagnosis in injury estimates. In one study using NEISS–AIP data, Quinlan et al8 estimated that approximately 955 000 persons had been treated in US EDs for whiplash injuries during the year 2000. While our study estimated that 955 588 persons were treated with a principal diagnosis of whiplash due to motor vehicle crash injury in 2004, after including both principal and secondary injuries, we estimated that the number of people with whiplash injury increased to approximately 1 127 000. This suggests that the NEISS–AIP may underestimate national whiplash injury count by as much as 18%, which could have important implications for preventive measures which are based on these estimates.
The inclusion of multiple injuries per person not only led to a substantial increase in the total number of injuries treated, but also to an increase in diagnosis-specific and body region-specific injury rates. This was not due to an increase in the total number of people injured in crashes overall, but instead to an identification of new incident cases of injury found by utilising the secondary injuries when determining incidence. It is necessary to keep in mind that by recognising multiple injuries per person, it becomes possible for one person to contribute an incident injury to more than one diagnosis and body region. While at least one other study in the literature has demonstrated an increase in the number of total injuries found by including multiple injuries in an injury surveillance system,13 no previous study has utilised multiple injuries to identify new incident cases of diagnosis-specific and body-region specific injury, and then use these to calculate revised diagnosis and body region specific rates. We found that by body region, the number of persons with lower trunk injury rose most steeply, with the rate of lower trunk injury doubling in comparison to principal lower trunk injuries alone. Furthermore, by diagnosis category, the number of persons with a diagnosis of contusion/abrasion increased the most relative to other diagnosis categories, leading to a rate ratio of 1.6 compared to principal contusion/abrasion injuries alone.
Although up to five possible injuries per motor vehicle crash victim were recognised in this study, the majority of total injury count was recorded among the first two listed injuries. The sum of the first two listed injuries among all crash victims accounted for 90% of the total injury count apparent among all five listed injuries. These results suggest that by coding one additional injury per case (principal or first-listed plus the second-listed injury), the NEISS–AIP could capture the majority of the motor vehicle-related injuries treated in the ED. Such a technique would also prove useful considering the new case definition of injury which has recently been recommended for national and state injury surveillance systems which use hospital ED data.14 This new broadened definition includes injuries based on the first-listed diagnosis code or the first-listed external cause of injury code, which could occur among any of the listed diagnoses.14 Using this new definition and counting both the principal diagnosis (first-listed) and the second-listed diagnosis for injury cases may provide a more complete assessment of the total number and rate of injuries in the population of interest as a measure of injury count, while preserving the epidemiological integrity of the data.
In this study, the inclusion of multiple injuries per case led not only to a more comprehensive portrayal of count and rate of injuries, but also allowed us to distinguish people with multiple injuries from those with an isolated injury treated in the ED. We found that persons treated for multiple injuries in the ED were significantly more likely to be hospitalised than those with an isolated injury, with hospitalisation percentages of 8% and 5%, respectively (p<0.001). The ability to distinguish between people with multiple and isolated injuries may be important when studying other outcome indices or patient populations. For instance, the relationship between multiple injury and clinical outcome has been well studied among hospitalised patients.131516 One study, for example, demonstrated that distinguishing multiple from isolated injury cases allowed a more precise characterisation of the need for ICU care, as well as for predicting mortality.13 In that study, although 22.5% of all trauma patients with a principal injury to the head required ICU care, this figure dropped to 13% for those whose head injury was their only listed injury. Similarly, whereas 5.8% of all trauma patients with a principal injury to the head died while receiving hospital care, this figure dropped to 3.1% for those with isolated head injuries.
The findings of this pilot study are subject to several limitations, one of which is inherent to the small size of a pilot study. First, due to the small sample size and the stratified probability sample design, national estimates of the number and rate of injuries for very specific injury types (other than whiplash) were unreliable and not reported. Even when utilising very broad injury sub-categories, a number of national estimates for these sub-categories were unreliable and, therefore, not reported. Second, this sample was a stratified random sample from 50 of 63 NEISS–AIP hospitals that agreed to participate. While the distribution of demographic characteristics of patients in our 15 NEISS–AIP hospital subsample were similar to those in the full 63 NEISS–AIP sample, it is possible that our subsample differed in some unmeasured characteristics relevant to risk of multiple injuries, such as those associated with severity of the crash (eg, speed at impact). Third, NEISS–AIP coders were trained to record ED discharge diagnoses in the order as listed in the ED record. While ED physicians typically order diagnoses in declining order of severity, physicians may use different criteria for determining severity, and may vary in terms of the types of injury they choose to list in the ED record. Finally, this study was limited to motor vehicle-related trauma treated in an ED setting; therefore, the findings may or may not be relevant when counting multiple injuries per case associated with other external causes of injury or in other treatment settings.
Conclusion
Multiple injuries requiring emergency care are common among persons treated in the ED for motor vehicle-related trauma. In this study, we have described the added number and increased rate of non-fatal injury that would be reported by a national surveillance system of ED-treated injury if multiple injuries per crash victim were included in national estimates. Although the underlying relative distribution of injuries was largely unaffected by the addition of secondary injuries, this study has demonstrated that the inclusion of secondary injuries allows for a more comprehensive portrayal of the total count and rate of injury attributable to motor vehicle-related trauma treated in EDs in the United States. Furthermore, this technique allows one to distinguish motor vehicle occupants with multiple injuries from those which sustained an isolated injury, which may be an important issue when studying injury outcome by hospitalisation, need for ICU care, risk of death, and risk of disability. An important quality of a surveillance system is its simplicity, and this study has demonstrated that by recognising and coding only one secondary injury in addition to the principal injury for each crash victim, an ED-based injury surveillance system could capture up to 90% of the total number of injuries sustained. This addition is likely to be a small investment in time and resources for the administration of the surveillance system and would significantly enhance the quality of its data. As a result, we would suggest that when developing and refining ED-based national injury surveillance systems around the world, administrators and public health officials strongly consider coding for and including at least two injuries per trauma case in their estimates of injury count and rate.
What is already known on this subject
With more than 2.6 million people treated in US hospital emergency departments in 2007, motor vehicle traffic occupant injury was the fourth leading cause for US hospital emergency department visits for non-fatal injury.
Many of these injured persons were treated for multiple injuries, yet multiple injuries are not accounted for when determining national estimates of injury count by the NEISS–AIP. This study examines and compares the national injury count determined by accounting for a single injury per person versus accounting for any multiple injuries.
Acknowledgments
We thank Tom Schroeder, MS, Cathy Irish, and Laura Noble, at the US Consumer Product Safety Commission for collecting and preparing the surveillance data used in this study and for their collaboration with the National Center for Injury Prevention and Control at the Centers for Disease Control and Prevention.
Footnotes
Funding This study was partially funded by the National Center for Injury Prevention and Control, Centers for Disease Control and Prevention.
Competing interests None.
Ethics approval This study was approved by CDC’s Institutional Review Board.
Contributorship: Conception: Dr Ann Dellinger, AG. Planning and design: AG, LA, JH. Data analysis: TH, JH. Data interpretation: JH, AG, LA, TH. Manuscript drafting: JH. Manuscript editing: AG, LA, TH. Guarantors: LA, AG.
Disclaimer: The findings and conclusions in this report are those of the authors and do not necessarily represent the official position of the Centers for Disease Control and Prevention or of the Agency for Toxic Substances and Disease Registry.
Provenance and Peer review Not commissioned; externally peer reviewed.