Article Text

Abstract
Objective: To estimate the effect of a new road traffic law against alcohol-impaired driving in Japan.
Methods: Japan passed a new road traffic law in June 2002 intended to reduce alcohol-impaired driving by decreasing the permissible blood alcohol level and by increasing penalties. Using data collected from police reports, the number of traffic fatalities and injuries were analyzed by time series.
Results: Simple comparisons of the average of all severe traffic injuries, traffic fatalities, alcohol-impaired traffic injuries, alcohol-impaired severe traffic injuries, and alcohol-impaired traffic fatalities per billion kilometers driven showed reductions after enactment of the new road traffic law in June 2002. The rate of alcohol-related traffic fatalities per billion kilometers driven decreased by 38% in the post-law period. In segmented regression analyses with adjustment for baseline trends, seasonality, and autocorrelation, all traffic injuries, severe traffic injuries, alcohol-impaired traffic injuries, alcohol-impaired severe traffic injuries, and alcohol-impaired traffic fatalities per billion kilometers driven declined significantly from baseline after the new traffic law.
Conclusion: Large, immediate public health benefits resulted from the new road traffic law in Japan.
Statistics from Altmetric.com
Traffic injury is a worldwide public health issue. Annually, more than a million people are killed on the world’s roads; in the USA there are over 40 000 motor vehicle fatalities each year.1 In April 2004, The World Health Organization (WHO) and World Bank released the World report on road traffic injury prevention.2 It stated that, in 1990, road traffic injuries were the ninth leading contributor to the global burden of disease, but are predicted to become the third leading contributor by 2020, unless appropriate action is taken.
Alcohol-impaired driving (AID) is a leading cause of traffic fatality both in developed and developing countries. A review of studies in low- and middle-income countries found that blood alcohol was detected in 33–66% of fatally injured drivers.2 Although drinking and driving legislation, including administrative license suspension, random screening, and lowering the legal blood alcohol limit, has been shown to reduce traffic fatalities, many countries have not enacted such measures.3
In Japan, the absolute number of traffic deaths fell from 11 451 in 1992 to 7358 in 2004, an average decrease of 3–4% per year. The National Police Agency (NPA) states that this reduction is due to improvements in policy, roads, vehicle engineering, driver behavior, and the nation’s emergency medical system.4
In the 1990s, blood alcohol was detected in 14–16% of fatally injured drivers in Japan.5 To reduce alcohol-related traffic fatalities, in June 2002, the Japanese government enacted a new road traffic law against AID. The law reduced the allowable breath alcohol test from 0.25 to 0.15 mg/l and blood alcohol concentration (BAC) from 0.05% to 0.03%, and increased the penalties for AID. The fine increased from approximately 50 000 to 500 000 Yen (US$425 to $4250 in 2002), and driver’s license points were severely imposed. Moreover the law made bartenders and passengers culpable in addition to arrested drivers.45
This study evaluates the impact of this new law on traffic injuries and fatalities in Japan using time series analysis. We test the null hypothesis that the new road traffic law did not reduce AID traffic fatalities, AID severe traffic injuries, or AID traffic injuries; nor did it reduce traffic fatalities, severe traffic injuries, or all traffic injuries. The alternative hypothesis is that there were significant changes in the time series intercept or slope after enactment of the law.
METHODS
Data and their source
Two data sources were used, the NPA Crash Reports and the Ministry of Land Infrastructure and Transport Driving Data. The NPA Crash Reports are managed by the traffic bureau of the NPA.4 Data on traffic crashes are reported by local police stations and then centralized by the NPA. The local police stations use a standardized protocol for data collection, and all data on injuries and deaths are supplied by emergency medical care professionals through medical certificates. Initially all the traffic incidents are collected in the local police stations, then are collected in the headquarters of the prefecture police agencies, and finally systematically reported to the NPA. However, the number of traffic injuries in the NPA Crash Reports is thought to be underestimated.6 Data on traffic crashes were provided anonymously through the website of the NPA in December 2005. We collected monthly data on the total number of traffic fatalities, severe traffic injuries, and all traffic injuries as well as the total number of AID traffic fatalities, AID severe traffic injuries, and all AID traffic injuries from January 1998 to December 2004.47
The Ministry of Land Infrastructure and Transport provides public monthly and annual data on total kilometers driven in Japan. Total kilometers driven is defined as the total distance driven by all of the registered vehicles in Japan. Total kilometers driven are measured on the basis of specifications by the census law. About 30 000 samples among 77 000 000 registered vehicles in Japan are chosen randomly and anonymously. Monthly total kilometers driven by each vehicle is exactly measured according to the odometer readings. We obtained the monthly data on total kilometers driven from January 1998 to December 2004 from the website of the Ministry of Land Infrastructure and Transport.8
The study used data available in the public domain, and was given human subjects exemption by the Harvard School of Public Health Human Subjects Committee.
Traffic injuries, traffic fatalities, and rates
In Japan, the sample of traffic injuries in motor vehicle incidents includes those of drivers and passengers, and 78% of traffic fatalities and 82% of all traffic injuries occur to drivers in the official police report.4 Traffic fatalities are defined as deaths within 24 h of a crash on a road involving a vehicle with an engine, the death being the result of the crash. Thus, fatality data include all motor vehicle-related deaths (eg, trucks, motorcars, motorcycles, bicycles, pedestrians). Severe traffic injuries are defined as injuries that resulted in more than 30 days of medical care after the incident, which includes both hospitalization and outpatient treatment. All traffic injuries are defined as any traffic injuries reported to the NPA, which include severe traffic injuries and fatalities. AID traffic fatalities, severe traffic injuries, and total traffic injuries are counted as the number of incident cases involving AID. Involvement of AID is determined by the police using breath tests. Before June 2002, AID was defined as a measurement of alcohol >0.25 mg/l by a breath test or >0.05% by blood alcohol test. After June 2002, AID was defined as >0.15 mg/l by a breath test or >0.03% by blood alcohol test. The number of AID cases was divided by total kilometers driven to calculate the rates for traffic fatalities, severe traffic injuries, and all traffic injuries.
In this study, we calculated rates using total number of traffic fatalities, severe traffic injuries, all traffic injuries, in addition to AID traffic fatalities, AID severe traffic injuries, and AID traffic injuries divided by total kilometers driven.
Statistical analysis
First, simple counts were made of the annual nationwide traffic fatalities from January 1998 to May 2002 (pre-law) compared with June 2002 to December 2004 (post-law). We next conducted segmented regression analyses to evaluate the effectiveness of the June 2002 traffic law on AID after adjustment for pre-intervention trends and for seasonality of traffic injuries.9 Because of the large number of observations, we assumed normal distributions of monthly rates and conducted least squares linear regression. We tested for first- and higher-order autocorrelation by calculating ordinal and generalized Durbin–Watson statistics.10 When autocorrelation was detected, we used stepwise autoregression to select the order of the autoregressive error models.11 Calendar month served as the unit of analysis, with the primary outcome measure being the event rate. Six events (monthly rate of traffic fatalities, severe traffic injuries, all traffic injuries, in addition to alcohol-related traffic fatalities, severe traffic injuries, all traffic injuries) were modeled. There were 84 monthly intervals: 53 before the intervention, and 31 after the intervention. The formula for the basic model is as follows:
Yt = β0 + β1* Timet + β2* Interventiont + β3*Time after Intervention t + β4*February + β5* March + β6* April + β7* May + β8* June + β9* July + β10* August + β11* September + β12* October + β13* November + β14* December + Vi
where: Yt is a monthly rate of traffic fatalities, severe injuries, and total injuries per vehicle kilometer driven per month; bi represent the coefficients of the model t; Time is a continuous variable indicating the time in months at time t from the start of the observation period (in this study it started in January 1998 through December 2004); Intervention is an indicator for time t occurring before (intervention = 0) or after (intervention = 1) the new law, implemented at month 54 (June, 2002) in the series; Time after Intervention is a continuous variable counting the number of months after the intervention at time t, coded 0 before the new traffic law and (time−53) after the new traffic law; and Vi is autoregressive errors. All analyses were conducted using SAS (SAS Institute, Cary, North Carolina, USA).
A change in either the level or the slope of the time trend beginning at the intervention date suggests an effect of the law.
RESULTS
In Japan in 2004, there were 7358 traffic fatalities within 24 h of a crash, 5.8 per 100 000 persons (table 1). Traffic injuries totaled 1 190 487 or 932 per 100 000 persons. Severe injuries, totaled 72 777, or 57 per 100 000 persons. The proportion of traffic fatalities to severe traffic injuries to total traffic injuries was 1:9.9:162. Just over 10% of all traffic fatalities were alcohol-related, under 3% of all serious traffic injuries were alcohol-related, and 1.9% of all injuries were alcohol-related.
Table 2 compares the average annual injuries rates per billion kilometers between January 1998 and May 2002 (pre-law) with the average rates between June 2002 and December 2004 (post-law). AID traffic fatalities fell by 38%, and AID traffic injuries fell by 33%; all traffic fatalities fell by 14%. For severe traffic injuries, AID traffic injuries, AID severe traffic injuries, and AID traffic fatalities per billion kilometers driven, there were reductions after the new traffic law was enacted in June 2002. There was no evidence of a reduction for all traffic injuries (+6%) during the same periods.
In segmented regression analyses with adjustment for baseline trends, seasonality, and autocorrelation, we found a significant change in the level of AID traffic fatalities (fig 1), AID severe injuries (not shown), and all AID traffic injuries per billion kilometers driven (fig 2). The baseline rate was significantly (p<0.01) reduced by 20%, 23% and 32% for AID traffic fatalities, severe traffic injuries and all traffic injuries, respectively.

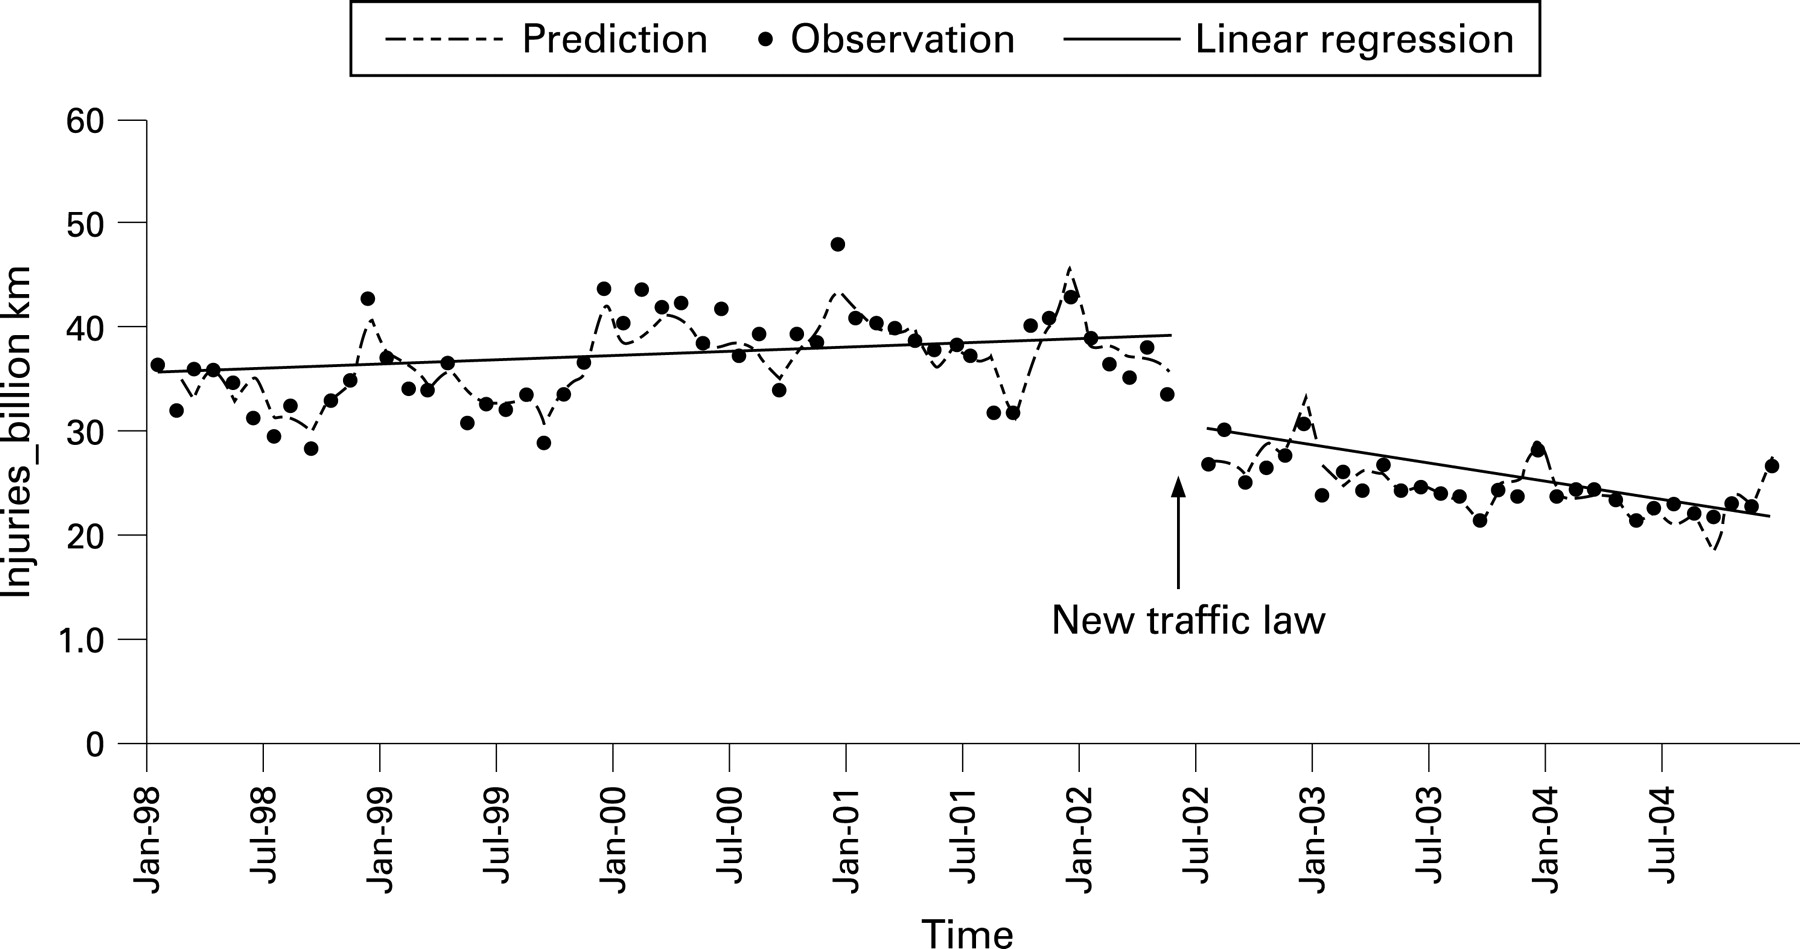
We found no significant change in the slope for time trend before and after the intervention for AID traffic fatalities (p = 0.14) (fig 1) and severe traffic injury (p = 0.07) (not shown). However, we observed a qualitative change in the slope (0.1 to −0.2) for total AID injuries (p<0.01) (fig 2).
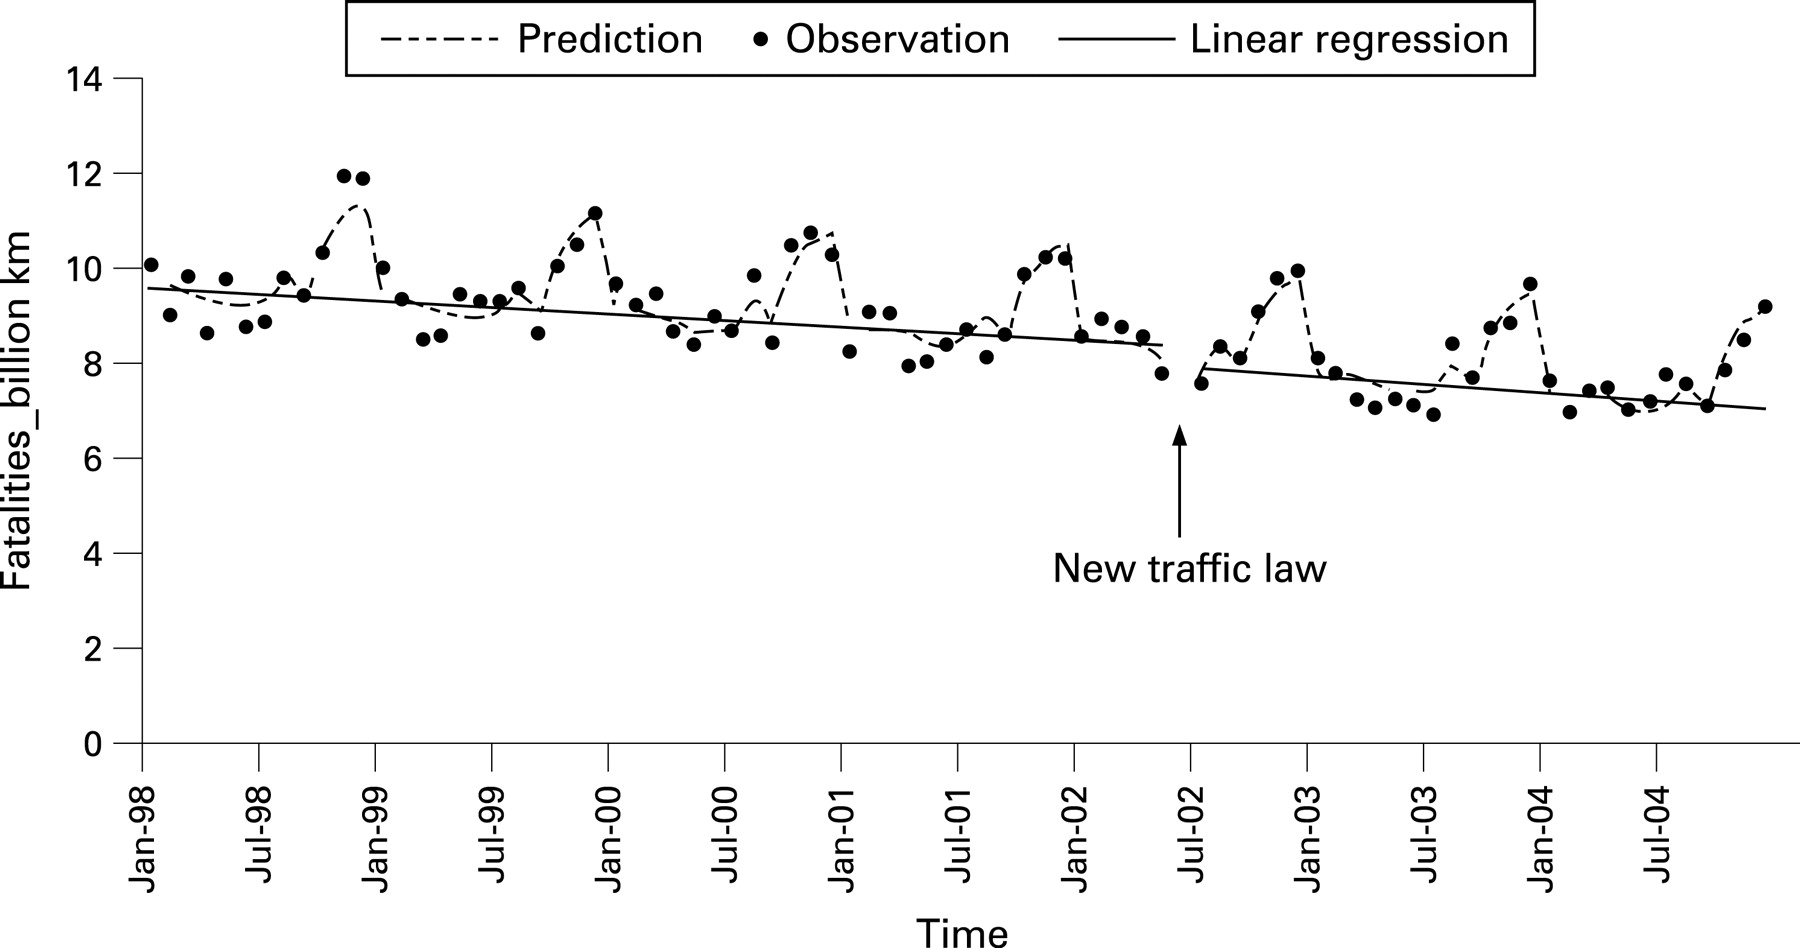
For all traffic fatality rates, we observed a 4% reduction in the baseline rates (p = 0.06), but the change in the slope (−0.024 to −0.017) was not significant (p = 0.51) (fig 3). We found 4% reductions in the baseline rates for both severe traffic injuries (p = 0.05) (not shown) and all traffic injuries (p<0.01) (fig 4). The slope in the trend changed from 0.06 to −0.16 for severe traffic injuries (p<0.01) and from 3.89 to 1.64 for all traffic injuries (p<0.01).

DISCUSSION
Following the 2002 new road traffic law, which increased the penalties for AID, Japan experienced a significant and substantial reduction in AID traffic problems: fatalities, severe injuries, and all injuries. These results were consistent across all traffic injuries (alcohol-related plus non-alcohol-related), severe traffic injuries, and also total traffic fatalities (p = 0.06). In Japan, AID traffic fatalities had been decreasing since the early 1990s, and it appears that the law had an effect over and above this trend. Hitosugi et al12 and Imai13 reported a decrease in traffic fatalities after the new law, but did not measure the effect against the already declining traffic fatalities since 1993 in Japan, nor were trends standardized by kilometers driven. This study used time series analysis to demonstrate the effect of the new traffic law, accounting for both the trend and driving exposure.14–16
Alcohol remains a major contributor to traffic death throughout the world, although much progress has been made. License suspension, illegal and administrative laws per se, selective and regular enforcement patrols, and sobriety checkpoints have been effective in reducing the harm caused by AID.217 The introduction of a legal BAC limit has been effective in the UK, Canada, The Netherlands, and Japan.2 In the USA, the introduction of the 0.08% BAC Law is controversial, but appears to have reduced AID; however, its effectiveness in reducing traffic injuries and fatalities has been debated.1415 An earlier 1970 law in Japan setting the legal BAC at 0.05% appeared to reduce traffic fatalities; however, it was not statistically evaluated.1819
Japan publicized the new law in a variety of ways, including mass media campaigns encouraging public transportation when drinking instead of driving. Not only the NPA but all the governmental agencies actively worked to announce the introduction of the road traffic law for AID. They also conducted a media campaign. The official advertisement for this campaign is memorable. In it, a drunken man tries to go home in his car. The bartender requests that he pay $4250 (equal to the drinking driving penalty in Japan), which is more than the average monthly salary of most workers. This advertisement gave viewers a strong impression of how severe the penalty would be.
In this study, we find that the reduction in AID traffic injuries and fatalities in Japan, 2002, was a successful public health intervention, and believe the lessons learned from this policy change will be useful for other countries trying to cope with AID problems.
We measured the effect of the new road traffic law on the decrease in victims of traffic crashes in a time series analysis. Time series analysis refers to a large series of observations made on the same variables repeatedly over time, and it is widely used in economic, physical, demographic, and public health studies to evaluate and predict the trend of a single characteristic in different time intervals.2021
Some weaknesses of simple pre–post comparison studies are that long-term trends, slow or delayed effects, regression to the mean, and the correlated data are not properly considered. Time series analysis can overcome these weaknesses, and characterize the change in trend associated with the intervention more clearly.
Key points
Each year, more than 7000 people die as the result of road traffic injuries in Japan.
In June 2002, the Japanese government enacted a new road traffic law to reduce AID.
By applying time series analysis, we determined that baseline rates of all traffic injuries, severe traffic injuries, AID traffic injuries, AID severe traffic injuries, and AID traffic fatalities per billion kilometers driven declined significantly after the new traffic law.
The Japanese policy appears to have been a successful public health measure.
The new road traffic law was associated with significant reductions in the baseline for all traffic injuries, all severe traffic injuries, AID traffic injuries, AID severe traffic injuries, and AID traffic fatalities per billion kilometers driven, and the total reduction in all traffic fatalities was borderline significant (p = 0.06). Only 15% of traffic fatalities in Japan were alcohol-related before the law, which has had its main impact on alcohol-related driving.412 After the law, alcohol-related fatalities fell to 11% (table 2). The primary effect of the new traffic law was to change the behavior of people who intended to drive a motor vehicle after drinking, which affected AID injuries but not the overall traffic fatality rate.
This study has various limitations. Firstly, the lowering of the definition of AID may have increased the number of alcohol-related traffic crashes after the law, which may have caused bias in the estimation of alcohol-related traffic events over time. For example, before the new law, drivers with a BAC of 0.04% would not have been counted as AID, whereas after the new traffic law was implemented, they would be. Unfortunately, the numeric results of breath or blood alcohol testing were not available, nor was there information on the extent of missing data on breath or blood alcohol tests in classifying alcohol-related motor vehicle events in Japan. Use of a consistent definition of AID throughout the period of observation was not possible because of changes in the law. However, the fact that significant reductions in AID events were seen after the law was enacted, even though the definition became more inclusive, suggests that AID reductions were considerable, and perhaps even larger than our estimates.
Secondly, data were not available on the proportion of drivers in non-fatal, serious injury, and fatal crashes who were tested for alcohol. In addition, the NPA does not have a standard protocol stipulating the acceptable time lag between collision and breath testing, and therefore it is unknown.
Thirdly, it was not possible to systematically control for external confounders such as other new traffic laws, campaigns, and overall alcohol consumption. However, to our knowledge no other major changes occurred between 1998 and 2003 that may have had a significant effect on traffic injuries. The commitment of law enforcement in the pre- and post-law period appears to be the same. A study showed that 140 460 people were arrested for traffic violation between January and June 2002 (pre-law), and 133 937 were arrested between January and June 2003 (post-law).47 The difference was not statistically significant.
Fourthly, it was not possible to stratify the data according to age groups, and therefore information about high-risk groups for traffic crashes, including alcohol-related ones, was not available from the public domain datasets used in this study. More detailed data will be necessary to examine the impact of the law on different age groups.
Our study finds that implementation of the new Japanese road traffic law was followed by a substantial decline in fatal and non-fatal motor vehicle injuries associated with AID. The Japanese policy appears to have been a very successful public health measure.
CONCLUSION
Despite some limitations, this study, by applying time series analysis, shows that the new Japanese road traffic law implemented in June 2002 had an effect on declining traffic injuries and fatalities. This success was obtained in several ways: decreasing the permissible blood alcohol level, increasing penalties, and an active media campaign. By describing the success of the AID intervention in Japan, the findings of this study may be helpful for other countries coping with the problems of AID.
IMPLICATIONS FOR PREVENTION
National policies can have a significant effect in reducing AID by using multidisciplinary approaches that include enforcement and educational campaigns targeting driver behavior.
Acknowledgments
We thank Dr Yeong-Su Ju, Takemi Program in International Health, Harvard School of Public Health, for supporting the data analysis, and Danielle Stockley, Department of Environmental Health, Harvard School of Public Health, for assistance with editing the manuscript.
REFERENCES
Supplementary materials
web only data 14/1/19
Files in this Data Supplement:
Footnotes
Competing interests: None.
Funding: MP received partial support for this work in the form of grant No T42 OH 008416-02, from the US National Institute for Occupational Safety and Health (NIOSH).
Linked Articles
- Correction