Article Text

Abstract
Objective: To describe the methods, characteristics of participants, and report on the preliminary findings of a longitudinal study of cyclists.
Design: Web-based survey to establish a cohort of cyclists.
Setting: Participants in the largest mass-participation bicycle event in New Zealand, the Wattyl Lake Taupo Cycle Challenge.
Participants: 2469 riders who had enrolled online in the 2006 Wattyl Lake Taupo Cycle Challenge.
Main outcome measures: Self-reported crashes in preceding 12 months.
Results: Of 5653 eligible riders, 2469 (44%) completed the study questionnaire. Mean age was 44 years, 73% were male, and the average number of kilometers cycled per week in the preceding 12 months was 130. The annual incidence of crashes leading to injury that disrupted usual daily activities for at least 24 h was 0.5 per cyclist/year. About one-third of these crashes resulted in presentation to a health professional. The mean number of days absent from work attributable to bicycle crashes was 0.39 per cyclist/year. After adjustment for potential confounders and exposure (kilometers cycled per year), the rate of days off work from bicycle crash injury was substantially lower among riders who reported always wearing fluorescent colors (multivariate incidence rate ratio 0.23, 95% CI 0.09 to 0.59).
Conclusions: Low cyclist conspicuity may increase the risk of crash-related injury and subsequent time off work. Increased use of high-visibility clothing is a simple intervention that may have a large impact on the safety of cycling.
Statistics from Altmetric.com
Physical inactivity is an important cause of common diseases. Globally, physical inactivity has been estimated to account for 21.5% of ischemic heart disease, 11% of ischemic stroke, and 14% of diabetes. Overall, 3.3% of deaths and 19 million disability adjusted life years are attributed to physical inactivity worldwide.1 The bicycle, an important means of transport in continental European countries,2 China and many low- and middle-income countries, offers a means to get more people active, to build physical activity into daily schedules, and reduce motor vehicle use. However, cycling is commonly regarded as dangerous because of the risk of crashes and injury.3
Many governments wish to encourage more cycling, but little is known of the barriers, particularly crashes and injury. Thus, uncertainty exists over how best to proceed to maximize health gain from increased cycling while minimizing risks and reducing barriers. Questions of the incidence of bicycle crashes and injury among New Zealand cyclists are unanswered by current data sources. Compared with the literature on other road user categories, relatively few studies have reported on the incidence and risk factors for bicycle injury.4 Moreover, previous studies5 of injuries among cyclists consist almost entirely of case studies and cross-sectional surveys, and there is a paucity of longitudinal data.
The Taupo Bicycle Study has been established as a web-based longitudinal study, with record linkage to the New Zealand Accident Compensation Corporation for injury compensation claims and the New Zealand Health Information Service for hospitalization and mortality data. In this paper, we describe the methods used to establish the cohort, the characteristics of riders taking part in the study, and initial findings from a cross-sectional analysis of baseline data. High-visibility or fluorescent clothing has been found in a case–control study of motorcycle injury to be a protective factor (adjusted relative risk of injury from wearing high-visibility clothing = 0.63).6 The association between bicycle crashes and the wearing of fluorescent colors was of primary interest in the present study.
METHODS
Setting
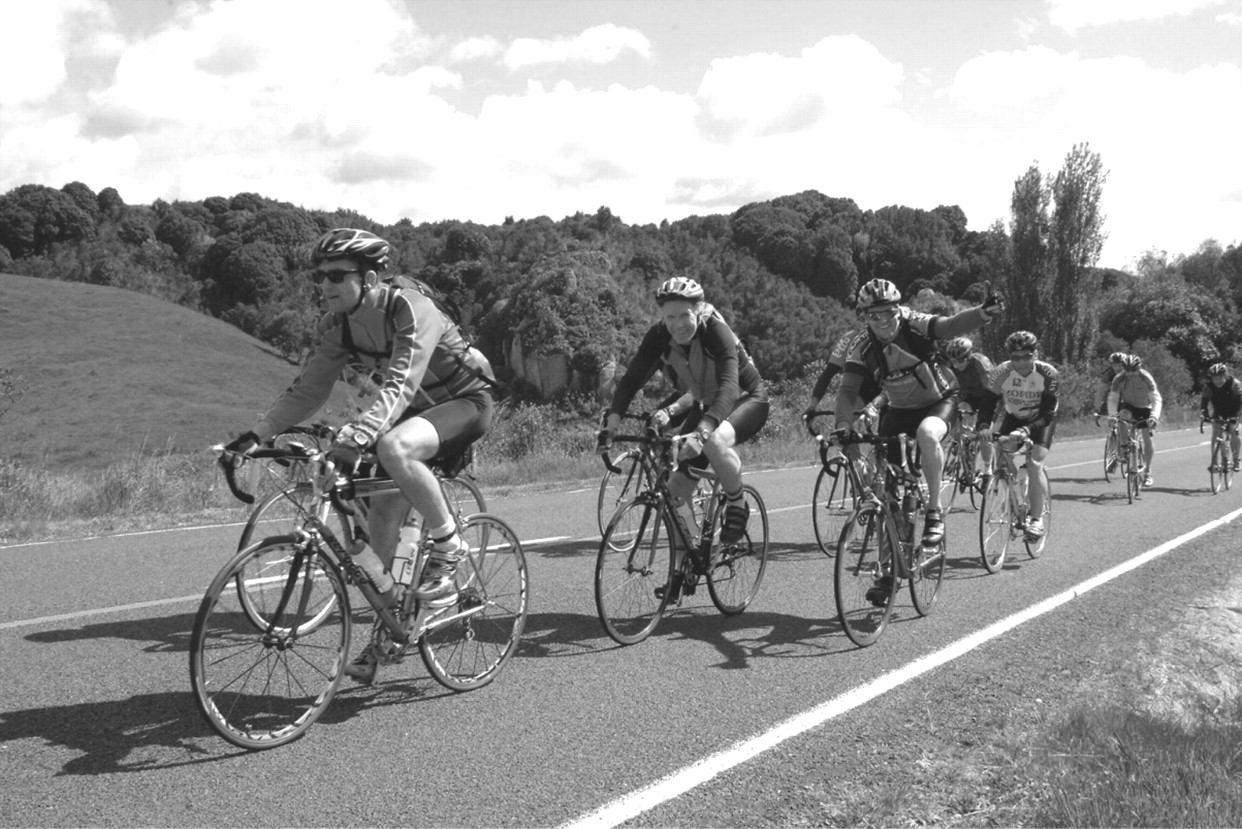
The Lake Taupo Cycle Challenge, New Zealand’s largest mass cycling event, attracts about 11 000 riders each year in the last weekend in November (fig 1). Contestants range from competitive sports cyclists (a small minority) and experienced social riders, who cycle the full 160 km around the lake, to relative novices of all ages who take part in relay teams. The relay teams make up about two-thirds of all riders in the event, most of whom ride 40 km each.

Study participants
Participants were recruited from riders, aged 16 and over, who had enrolled online in the 2006 Wattyl Lake Taupo Cycle Challenge (25 November 2006). Invitations to take part in the Taupo Bicycle Study were sent to the email addresses of 5653 contestants who had registered for the event, using the Websurveyor tool with two reminder notices. Invitations were thus sent out 9, 4, and 2 days before the event. Emails were sent out using the name and email address of the race organizers, with a hyperlink to an information page describing the study. At the bottom of this page, riders could click a button agreeing to take part in the study. This took study participants to the web questionnaire. Two prizes, NZ$5000 and NZ$1000 toward a bicycle purchase were offered as incentives. Ethical approval to undertake the present cross-sectional study, along with record linkage with hospital and compensated injury databases for 5 years, was granted from The University of Auckland Human Participants’ Ethics Committee. A total of 3998 riders agreed to take part in the study; 2469 completed and submitted the questionnaire (fig 2).

Survey
The survey covered participants’ demographic characteristics, height and weight, cycling activity over the preceding year, cycling experience, putative risk factors for bicycle crashes and injury (eg, colour of bicycle, helmet, and top; frequency of riding; light use; use of portable music; proportion of time riding off road and in darkness; wearing a helmet). Outcome variables used for the baseline cross-sectional analysis self-reported bicycle crashes in the preceding 12 months where the crashes were severe enough to (1) disrupt daily activities for the participant for more than 24 h, or (2) result in consultation of a health professional, or (3) result in one or more days off work.
Planned follow-up
Prospective data will be obtained through record linkage on bicycle crash injury outcomes that result in hospitalization or interaction with a health professional leading to a claim to the Accident Compensation Corporation (ACC). Follow-up is planned for 5 years, with annual surveys by email to update exposure status and self-reported injury.
Statistical analysis
Descriptive and multivariate statistical analyses were performed using Stata V8.0 (Stata Corporation, College Station, Texas, USA). Data are presented as means with 95% CI for continuous variables and counts for categorical variables. Poisson and negative binomial regression were used to examine the relationship between dependent variables (annual crashes or days off work from bicycle crash injury) and exposures. Outcome variables were overdispersed, with the sample variance greater than the mean, and thus in all cases negative binomial regression resulted in superior model fit, as indicated by improved log-likelihood values. Respondent age, gender, ethnicity, education, cycling experience, colour of bicycle frame/helmet/top worn when cycling, estimated average bicycle speed, bicycle type, and body mass index were included in the models. Models were constructed using binary variables for exposures or dummy variables to allow dose–response effects to be investigated. Estimated kilometers cycled per year was used as an offset in the model. Age group and gender were forced into the model. Other non-significant covariates were removed from final models, using a backward elimination algorithm. The significance level was set at p<0.05. Negative binomial regression was used for model building.
RESULTS
Of the 3998 riders who accessed the online study site, 2469 (62%) completed the survey. This means that 62% of those who accessed the website subsequently finished the survey, contributing to the database (fig 2). Age and gender were obtained for all who entered, online, the Taupo event as solo riders. The mean age of the study participants was similar to that of the solo riders in the event (44 and 42 years, respectively). There was a higher proportion of female entrants than expected from the solo rider category (27% of the study participants and 19% of the solo riders).
Baseline findings (table 1) show substantial heterogeneity of exposures (by gender), apart from ethnicity and helmet wearing, in which numbers are small in the “Maori”, and “not always wearing helmet” categories, respectively. A small proportion of riding time was spent riding off road (8.2% for men and women) and in the dark (9.9% for men and 6.6% for women).
The study sample was a select sample of the population, reporting a mean distance cycled per week of 130 km, largely undertaken as a recreational activity. National travel surveys report that less than 40% of the population aged over 20 years have cycled at least once in the last month.7 Participant body mass index provided one means of comparing the study population with population norms. In this study population, there was a slightly lower prevalence of overweight or obesity in male participants than general population norms (53% vs 60%, respectively); the difference was more marked for the female participants (29% vs 48%).8
The incidence of crashes (which disrupted daily activities for at least 24 h) in the preceding 12 months was 0.5 per cyclist/year, with approximately one-third of these resulting in interaction with a health professional (incidence 0.15 per cyclist/year). Days absent from work attributable to these crashes averaged 0.39 per cyclist/year. Univariate analysis showed that crashes and injury were more common among the male participants (table 2).
Modeling exposures and outcomes
All three outcome variables were modeled. Tables 3 and 4 show univariate and multivariate predictors of crashes and days off work from bicycle crash injury. Outcome variables were overdispersed, with the sample variance greater than the mean, so in all cases negative binomial regression resulted in superior model fit, as indicated by improved log-likelihood values. Plots of predicted versus observed probabilities generated for final models used to predict outcome variables showed excellent correlation, indicating good global model fit. Owing to missing values, the final sample size used for model fitting was 2393 (cf total 2469).
To determine whether the data on reported exposure to riding within the preceding 12 months were within a realistic distribution, average speed was calculated for participants by combining average time and distance cycled per week (speed = distance/time). This information was not sought in the questionnaire because we hypothesized that participants are better judges of distance and time than average speed. The median average speed was 23.3 km/h with lower and upper interquartile ranges of 18.9 and 26.7 km/h, compatible with average speeds of 10–35 km/h. This expected variation is due to a range of factors such as ability, experience, fitness, terrain, weight of bicycle, and rider.
In the multivariate analysis, predictors of crashes disrupting daily activities for more than 24 h were imputed average speed, experience, ever riding in the dark, ever riding off road, bike type, use of back light when riding in the dark, and always wearing fluorescent colors. Increased average speed was associated with reduced rate of injury. Not shown in table 4 are the statistically significant associations for crash injury resulting in the rider presenting to a health professional. These include age group (increasing age posed greatest risk; age 16–34 incidence rat ratio (IRR) = 0.64 (95% CI 0.45 to 0.90) compared with referent age 35–49), highest education level achieved (never attending university IRR = 0.71 (95% CI 0.55 to 0.91) compared with university education), body mass index (overweight IRR = 0.73 (95% CI 0.56 to 0.97) and obese IRR = 0.63 (95% CI 0.37 to 1.09) compared with normal weight), and “not always wearing a helmet” IRR = 3.30 (95% CI 1.34 to 8.10) compared with “always wearing a helmet”. Statistically significant findings for days off work from bicycle crash injury included average speed, riding in a bunch, experience (6–10 years), and fluorescent colour use (table 4).
The association between fluorescent colour use and crash outcomes was examined in more detail. Proportion of time cycling wearing fluorescent colors was estimated on a Likert scale with categories including 0% (n = 491), 25% (n = 334), 50% (n = 447), 75% (n = 441) and 100% (n = 735). Negative binomial regression analysis (using days off work from crash injury as the outcome) showed that compared with always (100%) use of fluorescent colors, 0% (never use) was associated with an adjusted IRR of 8.33 (95% CI 2.59 to 26.74), and 25%, 50% and 75% use were associated with IRR = 2.34 (95% CI 0.60 to 9.15), IRR = 1.85 (95% CI 0.55 to 6.23) and IRR = 4.06 (95% CI 1.12 to 14.69), respectively.
The attributable risk for “never using fluorescent colors” compared with “always use” was 23.1% for crash-related days off work. If all exposure categories of fluorescent colour use were included, the population attributable risk of never wearing fluorescent colors was 70.2% for the same outcome.
DISCUSSION
The key finding of this study is the strong link found between cyclist conspicuity and bicycle crashes. An eightfold reduction in days absent from work was observed between “never” and “always” wearers of fluorescent colors. Greater average speed and increased body mass index, exposures that may relate to conspicuity, were also associated with reduced rate of injury outcomes.
Key points
Low cyclist conspicuity may increase the rate of crash-related injury.
Increased use of high-visibility clothing by cyclists is likely to reduce injury.
Low average cyclist speed and low body mass index may also increase the rate of crashes.
Days off work due to a bicycle crash injury may provide a useful outcome for assessing risk factors for bicycle crashes that involve motor vehicles.
The results of this baseline analysis should be interpreted cautiously because of the limitations of the cross-sectional design and uncertainty regarding the validity of self-reported outcome and exposure data. More robust outcomes are expected with record linkage to routinely collected health statistics in the longitudinal study. Cross-sectional analyses may also suffer from underestimating effects due to survivor selection. In this case, participants who have had severe crashes are less likely to “survive”—that is, participate in the Lake Taupo Cycle Challenge—and register for the study. Some exposure variables (eg, duration and distance cycled) may tend to be overestimated because of the administration of the questionnaire before an event when participants are likely to be riding more hours per week than usual.
Risk-taking behavior is a potential confounder in all observational studies of injury and is difficult to measure reliably because of the likelihood that participants will provide socially desirable responses. “Reverse causation” can also complicate cross-sectional analyses, if outcomes influence exposures. In this study, such a mechanism would be expected to reduce associations rather than inflate them—for example, a bicycle crash may prompt a participant to use fluorescent clothing.
Web-based data collection limited study participation to those who supplied an email address to the event organizers. Therefore, this sample is likely to include a higher proportion of people with above-average income and education than the general population—for example, 53.3% of participants reported having attained a university qualification compared with 2006 NZ census data that report 14.2%.9 The majority of study participants were in the solo category, because event organizers emailed individualized invitations to riders in this category, whereas only generic invitations were sent to relay team leaders. The study suffered from a high attrition rate with respect to completion of the online survey (39% abandonment), which means that more-motivated responders were more likely to have completed the questionnaire. Reasons for the high drop out rate after the study web site had been read include (1) length of the questionnaire (40 elements maximum), (2) several complex logic checks built into the design of the online questionnaire which resulted in many queries to study staff (principally involving the date of birth field, using the unfamiliar “DD-MMM-YYYY” format which prompted error messages if filled in incorrectly), and (3) the slow download speed of the survey on dial-up internet connections.
Participants cannot be considered representative of all New Zealand cyclists, but this study has recruited a large sample of cyclists and established an epidemiological database where exposure and outcome data could be ascertained efficiently and at relatively little cost. Despite the differences in cycling behavior between the sample and the general population, we hypothesize that risks identified in this cohort will be valid for all riders and traffic environments similar to New Zealand, where cycling is a marginalized mode of transport. The study population is likely to provide sufficient heterogeneity to inform estimates of the associations between exposures and outcomes of interest. On the basis of cross-sectional analyses of the baseline data, a number of factors that increase the rate of crashes and injury have been identified, most importantly, the use of fluorescent colored tops, body mass index, average cycling speed, cycling experience, and age. Days off work is likely to provide an index of more severe injury which has previously been associated with involvement of a motor vehicle in bicycle crashes.10 An important distinction was made in the questionnaire between use of reflective and fluorescent colors. In this study population, wearing reflective colors was not linked with a reduction in bicycle crashes.
Outcomes measured in this study (crash, crash injury resulting in presentation to a health professional, and days off work from crash injury) represent different indices of crash injury; however, some exposures were associated with all outcome measures. Increased average cycling speed was consistently associated with reduced rate of cycling injury. We had expected that higher average speed would be associated with a higher crash risk as observed in studies of crashes of motorized vehicles.11 The study finding may be explained by errors in self-reports of time and distance cycled or more experienced riders reaching higher average speeds. Speed may be confounded by the skill of the rider, although adjustment by experience (years of regular riding), which is likely to be closely associated with skill, did not alter the results appreciably. We note the consistent association across all outcome measures, and the “dose–response” relationship observed, with highest speeds associated with lowest rates. This may reflect the ability of faster riders to more easily integrate with traffic flow and be more readily perceived by drivers. Increased body mass index was associated consistently with a reduction in rate and is strongest for more severe injury. We speculate that larger riders are more visible to motorists. Non-helmet wearing was not associated with an increased rate of crashes in general, but the very small numbers of riders who reported “not always wearing a helmet” were more likely to present to a health professional after a crash. This is consistent with a protective effect from helmet use in relation to crash-related injury.
What is already known on this topic
Increased conspicuity has been shown to be associated with reduced crash risk for car drivers and motorcyclists.
Indirect measures, such as the time taken for car drivers to recognize cyclists, suggest that riders who wear fluorescent colors may be involved in fewer road crashes.
What this study adds
This cross-sectional study found an eightfold reduction in the rate of days off work due to a bicycle crash in riders who reported “always wearing fluorescent colors”, compared with “never wearers”.
Low average speed and low body mass index were also associated with an increased rate of days off work due to bicycle crashes.
Most of the epidemiological literature describing bicycle crashes and injury comes from uncontrolled case series data from emergency department presentations, hospitalizations, and records of traffic safety authorities.101213 Some studies suggest that the vast majority of injuries arise from rider-only crashes (74% in one series), with only a small proportion (6%) attributable to collisions with motor vehicles.13 In this study, 40/636 (6.3%) participants who had at least one crash (disrupting daily activities for more than 24 h) attributed not being seen by traffic as “important” or “extremely important”. However, the other two outcomes were more often attributed to not being seen by a motor vehicle. For those reporting at least one presentation to a health professional resulting from a bicycle crash, the proportion was 73/266 (27.4%), and, for those who had at least one day off work due to a bicycle crash, this proportion was higher still: 28/86 (33%).
Trials of driver recognition have shown that cyclist and pedestrian use of fluorescent colors increases detection and recognition time by drivers,14 but, to our knowledge, no observational or experimental studies have previously shown a reduction in rate of bicycle crashes. We suggest that an intervention study is warranted, with randomization of fluorescent colour use to control for potentially confounding factors, particularly risk-taking behavior. The case-crossover study design may also be applied to assess the effect of wearing fluorescent colors, considering the reversibility of risk, and the distal nature of the exposure in the causal pathway. This approach allows control of between-person confounding factors, although recall bias of the control exposure period is a potential threat to validity.
On the basis of these results, combined with the well-established phenomenon of “safety in numbers”,15 we suggest that a common mechanism of collisions may be the failure of motorists to perceive and respond to cyclists. Cyclists able to “mimic” cars—by virtue of increased speed and size—may be more likely to be recognized by motorists and therefore avoided. Use of fluorescent colors may “shock” drivers’ perceptual systems into seeing cyclists who would have been missed otherwise. If this is true, transport planning that seeks to integrate, as much as possible, motor vehicles and bicycles, and hence increase the familiarity of cyclists to car drivers, may have a beneficial effect on the risk of a crash and injury.
IMPLICATIONS FOR PREVENTION
This study identifies modifiable risk factors and points the way to interventions that may reduce the burden of injury associated with bicycling—for example, subsidized provision of fluorescent vests to cyclists by employers or local authorities.
Acknowledgments
Keith Crate and Dave Anderson from the Lake Taupo Cycle Challenge. Amanda Milne, Barry Gray, Stephen Vander Hoorn, and Ruey-Bin Lin from Clinical Trials Research Unit, University of Auckland.
Footnotes
Competing interests: None.
Funding: This study was funded by the University of Auckland.