Article Text

Abstract
Objective: To describe and illustrate the geographic distribution of pedestrian crash sites in an urban setting (Montreal, Canada) with an alternative data source.
Methods: Data on pedestrian victims were extracted for a 5-year period (1999–2003) from ambulance services information systems. The locations of crash sites and pedestrian victim density were mapped using a geographic information system. Pedestrian “black spots” were defined as sites where there had been at least eight pedestrian victims.
Results: The 22 identified black spots represent only 1% of all city intersections with at least one victim and 4% of all injured pedestrians, whereas 5082 victims were injured at >3500 different crash sites. The number and population rates of injured pedestrians are greater in central boroughs. Accordingly, the density of pedestrian victims is much higher in central boroughs. Over the 5-year period, in some central boroughs, pedestrian crashes occurred in up to 26% of intersections.
Conclusions: Ambulance information systems were relevant to map pedestrian crash sites. Most pedestrians were injured at locations that would have been missed by the black spot approach. This high-risk preventive strategy cannot substantially reduce the total number of injured or the insecurity that many pedestrians experience when walking. Considering the large number and widespread occurrence of pedestrian crashes in Montreal, prevention strategies should include comprehensive environmental measures such as global reduction of traffic volume and speed.
- GIS, geographic information system
Statistics from Altmetric.com
Five pedestrians a day are injured from motor vehicle collisions on the island of Montreal (Canada).1 The 1830 pedestrians injured in 2005 represent almost half (47%) of all pedestrians injured in the province of Quebec, even though only a quarter of Quebecers live on the island. Moreover, pedestrians are more likely to experience severe injuries: among all road users injured in Montreal, pedestrians represent 14% of people injured, 29% of hospitalizations and 47% of road deaths.2 To improve the safety of vulnerable road users in a motorized urban setting such as Montreal, public health interventions must influence transportation planning, a process rarely based on health issues, and provide timely and useful information.3
It is routine practice to monitor car crashes and their consequences in Quebec, but crash reports, death certificates or hospital discharge forms are often analyzed without consideration of crash site distribution across the road network.1,4 Although ecologic studies are useful to describe spatial patterns and identify environmental risk factors,5–7 they cannot pinpoint specific streets or intersections owing to the limits of aggregated data at the census tract or neighborhood level.8,9 Nowadays, the development of geographic information systems (GIS) allows for disaggregated analysis of crash sites.10,11 However, even if the precise locations of all crash sites could be known and analysed, transportation department interventions are still restricted to the most hazardous locations.12,13
In their review of black spot literature, Joly et al14 pointed out that there was little continuity in the definitions and selection criteria of “black spots”, a problem that still persists.15 Whatever the precise definitions and methods, derived from probability models or measured crash frequency, this kind of analysis focuses on only a small proportion of injured people. Indeed, results of these investigations do not provide a broad picture of the magnitude of the problem, especially in urban settings. For example, a well-documented Montreal study retained 138 black spots, which added up to only 6% of road crashes over a period of 3 years.16 More recently, Montreal listed nine black spots for pedestrians, representing 3% (46 victims) of pedestrians injured in 2002.13
In Quebec, crash reports filled out by police officers have technical limitations (eg, standardization of entered data) that currently prevent their use to easily map crash sites.17 On the other hand, emergency services GIS (ambulance and 911) contain information on crash sites (geographic coordinates) and on victims (road user type, injury severity score, etc), but have not been used for road safety analysis.
The objective of this research was to describe and illustrate the geographic distribution of pedestrian crash sites across the city with information gathered by Montreal ambulance services, an alternative source of data.
METHODS
Urgences-santé dataset
The population studied includes all injured road users for whom an ambulance was sent on the island of Montreal between 1 January 1999 and 31 December 2003. The Urgences-santé Corporation, Montreal’s ambulance service, is the single source of data as it has a monopoly on the territory covered. The dataset was extracted from original files of two subsets: incoming calls (geographical coordinates) and pre-hospital intervention reports (road user category, age, sex and severity scores). The validation process excluded duplicate calls or reports (n = 25), pedestrian falls (n = 688) and events with missing geographic coordinates (n = 76); 5082 pedestrian victims were retained for this analysis.18
Mapping and analyses
For every call made to 911 in Montreal, the caller’s address is automatically sent to Urgences-santé and the location of the victim is validated over the phone. This location is instantly mapped in a GIS to dispatch and guide an ambulance. For the purpose of our project, these locations were assumed to be crash sites. The mapping of all crash sites and the density calculations were executed in ArcGIS.19 Pedestrian victim density was computed with a pixel size of 10 m and search radius of 500 m. Identical locations were aggregated and the Montreal hierarchical street network (called geobase) was used to combine locations within a radius of 15 m of an intersection.20 Pedestrian black spots were defined as sites where there had been at least eight pedestrian victims within a 5-year period (1999–2003). Crash sites were categorized into local streets and major roads (major or minor arterial roads and collector roads). The number of victims was calculated for each Montreal borough, as delimited in 2001. Finally, rates were calculated with population data from the 2001 population census, and descriptive analyses of other attributes were performed using SPSS V.11.21
RESULTS
Age and sex
An almost equal number of male (51%) and female (49%) pedestrians were injured. The population rate is higher for younger age groups (5–19 years old) and older people (⩾65 years) compared with the overall rate (419, 310 and 280 pedestrians injured/100 000 inhabitants, respectively).
Location of black spots
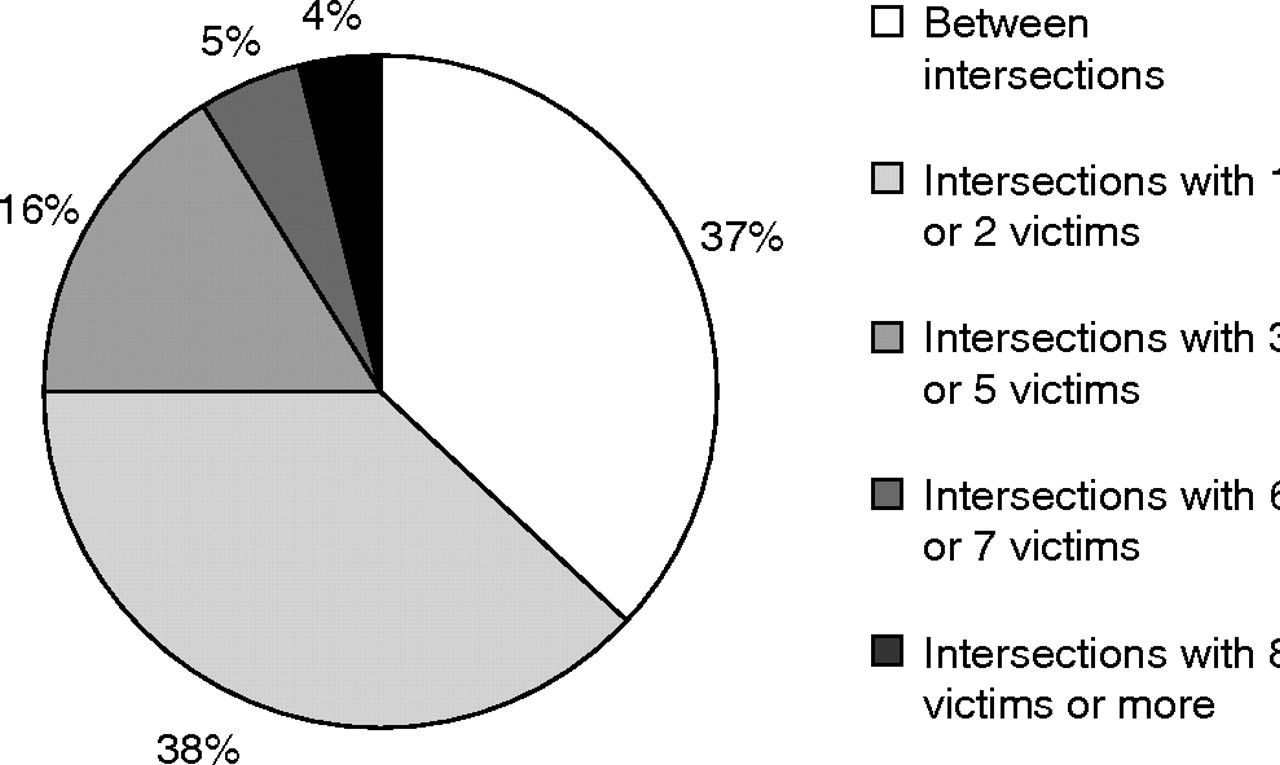
Three quarters of injured pedestrians were hit between intersections (37%) or at street corners where only one or two pedestrians had been injured (38%; fig 1). There are only 22 intersections where ⩾8 pedestrians had been injured in the 5-year period, and they are mostly located in central boroughs (table 1). These sites represent 1% of all the city intersections with at least one victim, and 4% of all injured pedestrians. In fact, the 5082 victims were injured at >3500 different sites.
Descriptive indicators (1999–2003)

Distribution of injured pedestrians at or between intersections (1999–2003).
Spatial distribution of pedestrian crash sites
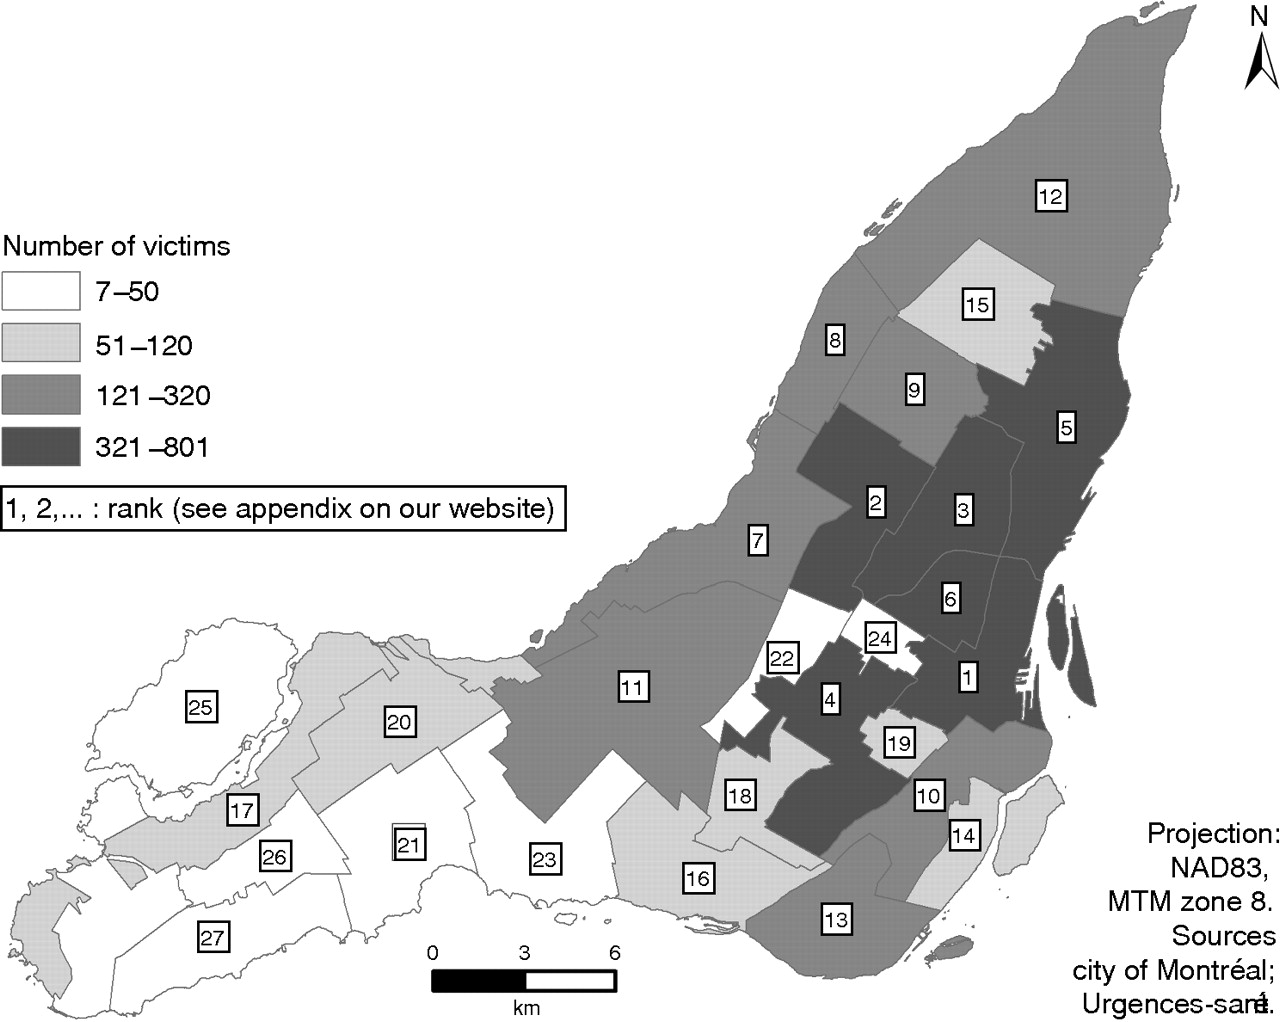
Although there are crash sites in every part of the island, the number of injured pedestrians is greater in central boroughs (table 1; fig 2). Population rates are also higher in central boroughs than in eastern and western boroughs (354, 233 and 140/100 000 inhabitants, respectively).

Number of pedestrian victims for each Montreal borough according to Urgences-santé (1999–2003).
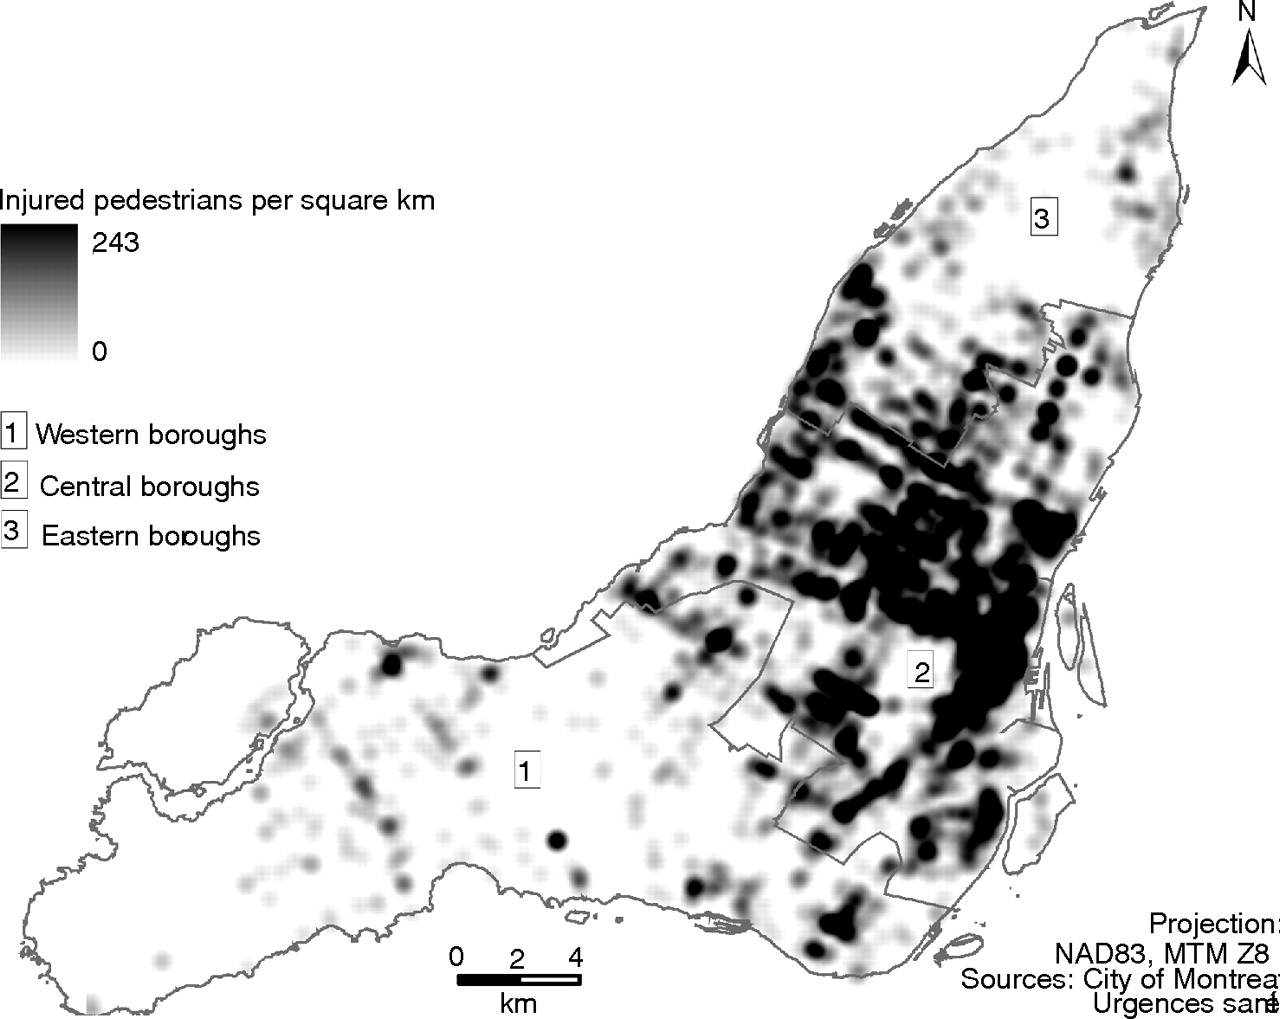
Figure 3 shows the high density of pedestrian crash sites in central boroughs. In some boroughs, pedestrian crashes occur at up to 26% of intersections. As different crash sites are added over the years, these proportions increase for each extra year considered, as table 2 shows. Over a 5-year period, few streets are free of crash sites. Further, it should be noted that pedestrian crashes occur on local streets (19%) and on major roads (44%) or their intersections (37%).
Number and proportion of intersections with at least one pedestrian victim according to period of observation

Density mapping of pedestrian victims.
Figure 4 shows the widespread distribution of pedestrian crash sites in a typical central borough where there is a high level of through traffic: Rosemont/Petite-Patrie is an established working-class residential neighborhood located northeast of the downtown area. This borough has only three black spots but 345 different pedestrian crash sites over 5 years.

Distribution of pedestrian victims in Rosemont/Petite-Patrie according to Urgences-santé (1999–2003).
DISCUSSION
Towards integration of different sources of information
This study aims to illustrate the problem of pedestrian safety for a whole area, not only for a sampling of intersections or a specific neighborhood. The availability of precise proxy geographic locations supports the use of ambulance information systems to map pedestrian crash sites at a regional or local level. The number of pedestrians included in our study represents 57% of all pedestrian victims reported by police services for the same period.1 It is not known how these two data sources overlap, but it has been reported that health services datasets provide cases missed by police datasets.22,23 It would be useful to merge different sources of information on road traffic crashes into a spatially referenced database. Such a database would probably provide more information on the location, circumstances and outcomes of a larger number of pedestrian crashes and victims for each year.
The usefulness of GIS
Our descriptive results show the potential usefulness of a spatially referenced database for safety initiatives. This first step provides precise positioning of pedestrian crash sites on the streets with the help of a GIS. The next step would be to link road injuries with local mobility to estimate the risk for each kilometer walked. Further research should also analyze the role of traffic volume, street configuration and macro-level factors such as urban design. With the integration of such variables, GIS and spatial analysis may help shift prevention toward environmental approaches.
Implications for prevention: the need for large-scale broad interventions
Most pedestrians were injured at locations that would have been missed by the black spot approach, a high-risk preventive strategy.24 Although the classic black spot method can identify a few specific places of great concern, it cannot lower substantially the total number of injured or help reduce the insecurity that many pedestrians experience when walking. Moreover, the alleged efficacy of black spot safety programs may be confounded by many factors such as regression to the mean effect, crash site migration or changes in traffic patterns.12 In Montreal, despite targeted interventions, the number of road victims increased by 17% from 1998 to 200325.
Our results show that pedestrian crash sites are broadly dispersed in Montreal. Over a 5-year period, pedestrians were injured at a quarter (26%) of intersections in some central boroughs. The number and proportion of intersections involved would still increase with a longer observation period or with a merged database counting all victims. Citing Rose24: “The high-risk preventive strategy (…) is an inadequate response to a common disease or a widespread cause”. Our study was inspired by the population approach, which considers all pedestrian crashes, rather than only those at intersections where they occur most frequently. As the distribution of crashes among intersections follows a Poisson distribution, there is obviously a need to also act on intersections with a lower probability of crashes to reduce the incidence rate.
In Montreal, it seems doubtful that the total number of road victims can be reduced without a strategy embracing all central boroughs. The global reduction in traffic volume and speed combined with the generalization of measures to protect pedestrians crossing at intersections would be the most appropriate and powerful strategies.26–28 This approach would imply the control of urban sprawl, the implementation of road pricing and parking restrictions, the improvement of public transit, area-wide traffic calming, speed enforcement and other simple measures such as the prohibition of curb parking near intersections, which is still allowed almost everywhere in Montreal.
CONCLUSION
The geographic distribution of pedestrian victims highlights the widespread insecurity people experience in Montreal when walking. Hundreds of millions of dollars are spent yearly in Montreal to repair the road system and accommodate ever-increasing car traffic; some resources should also be dedicated specifically to pedestrian safety. Modifying the urban environment according to pedestrian needs would have many health benefits other than injury prevention that would be related either to increased physical activity or reduced pollution.2,3,29–32 Considering the diversity and severity of health problems associated with ongoing motorization, we, as public health professionals, should consider the priority given to the automobile in our cities.
Key points
-
The geographic coding of ambulance information systems provides relevant information to examine pedestrian crash locations.
-
In Montreal, Canada, locations of pedestrian crash sites are widespread in central boroughs.
-
Limiting analyses and interventions solely to “black spots” largely fails to deal with the area-wide problem of pedestrian safety.
Acknowledgments
We thank all the people at Urgences-santé, particularly Éric Lareau, Gisèle Ouimet and David Beaumont. We also thank Lise Gauvin from Université de Montréal.
REFERENCES
Footnotes
-
Funding: This project was funded by the Programme de subvention en santé publique du Ministère de la Santé et des Services sociaux (2004).
-
Competing interests: None declared.
-
Preliminary results were presented as a poster in French at the Journées Annuelles de Santé Publique du Québec in 2004. The English version was edited by Sylvie Gauthier.
Linked Articles
- Commentary