Article Text

Abstract
Introduction Traffic injury is a leading and preventable cause of child death and disability, with child pedestrians and cyclists particularly vulnerable. Examining built environment correlates of child pedestrian and cyclist motor vehicle collisions (PCMVC) in different settings is needed to promote an evidence-based approach to road safety.
Methods We conducted a cross-sectional study across multiple urban/suburban environments in Canada (Calgary, Toronto, Montreal, Laval, Peel Region). All public elementary schools were included (n=1030). We examined the role of land use/social environments, road environments and traffic safety interventions on the rates of child PCMVC within 1000 m of schools. Multivariable negative binomial regression was conducted for all cities and by individual city. In a subset of schools (n=389), we examined associations when controlling for active school transportation (AST).
Results Mean PCMVC rate per school ranged from 0.13 collisions/year in Peel to 0.35 in Montreal. Child PCMVC were correlated with land use, social and road environments and traffic safety interventions. In fully adjusted models, social and land use features remained the most important correlates. New immigrant population had the largest positive association with child PCMVC (incidence rate ratio (IRR): 1.26, 95% CI 1.06 to 1.50), while old housing (pre-1960) density was most protective (IRR: 0.83, 95% CI 0.77 to 0.90). AST was associated with PCMVC, but it had no effect on the relationships between PCMVC and other social/environmental correlates.
Conclusion The built environment and social factors influence rates of child PCMVC. Opportunities to reduce child PCMVC exist through modifications to city design and road environments and implementing traffic safety interventions.
- pedestrian
- bicycle
- environmental modification
- child
Data availability statement
Data are available upon reasonable request.
This is an open access article distributed in accordance with the Creative Commons Attribution 4.0 Unported (CC BY 4.0) license, which permits others to copy, redistribute, remix, transform and build upon this work for any purpose, provided the original work is properly cited, a link to the licence is given, and indication of whether changes were made. See: https://creativecommons.org/licenses/by/4.0/.
Statistics from Altmetric.com
Introduction
Traffic injury is a leading and preventable cause of child death and disability. While child motor vehicle occupant injuries have declined in Canada, child pedestrian and cyclist motor vehicle collisions (PCMVC) have not, with an increasing proportion of motor vehicle collision injuries and deaths occurring in this vulnerable road user group. In 2019, there were 1457 injuries and 20 fatalities reported to police among child (0–14) pedestrians and cyclists in Canada.1 There is a lack of evidence correlating road safety education with a reduction in child pedestrian injury .2 If education does not work, other approaches, such as built environment modification, should be studied.
A recent state of the art review described how modern approaches to road safety emphasise safe system design and challenge city planners to create spaces that protect vulnerable road users .3 Vision Zero road safety plans adopted in Europe and North America aim to eliminate severe traffic injuries and fatalities.4 5 Improving traffic safety also offers additional health and societal benefits, such as increases in active transportation.6 7 However, there is little empirical information on the relationship between built environment and PCMVC across North American cities, and little agreement on the influence of pedestrian and cyclist volumes on this relationship.3 Previous research in Toronto, Canada found that the proportion of children walking to school was not associated with more child PCMVC, if the built environment around schools was safer.8
The purpose of this study was to assess the built and social environment correlates of child PCMVC in diverse Canadian urban/suburban environments, so as to help identify features of safe roadway environments. This study is part of the CHild Active-Transportation Safety and the Environment (CHASE) Team grant.9 We focused on areas around elementary schools (students from 4 to 11 years), as these are environments with increased child pedestrian and cyclist activity, and the highest rates of severe and fatal child PCMVC.10
Research questions
Are child PCMVC related to built environment features around schools in Canadian cities?
Does the proportion of children using active transportation to school influence this relationship?
Methods
Setting
This study was conducted in five municipalities and regions across Canada, including three large Canadian cities (Calgary, Toronto, and Montreal) and two contiguous suburbs (Laval and Mississauga and Brampton in Peel Region).
Design
We used a cross-sectional study design to examine the built and social environment correlates of PCMVC around schools (full details in the CHASE team research protocol9).
Sampling frame
All public elementary schools (students 4–11 years) were included (n=1030) in the primary analysis. Middle schools (students 12–13 years), high schools (students 14–17 years) and specialised schools (eg, arts, alternative) were excluded as they often have longer travel distances for students and, therefore, different travel modes.11 In addition, older children in middle and high schools have different traffic skills than do the younger elementary school children. Therefore, we decided to focus specifically on the elementary school age children for consistency.
We observed the proportion of students arriving at school by walking, cycling or driving at a subset of schools (n=389) using a validated methodology.8 12 In the larger regions (eg, Toronto and Peel, Montreal and Laval), we used a stratified random sample of schools, based on neighbourhood socioeconomic status (using the after-tax low-income cut-off) and the Walkscore, a walkability index.12 13 This subsample was used in a secondary analysis, examining whether active transportation levels influence the relationship between built and social environment correlates and PCMVC.
Variables
Measures were standardised across municipalities, with data from the 2016 Canadian census, national land use and roadway files.14–16 Standardised data sources across municipalities (eg, 2016 Canadian Census, DMTI) were used wherever possible, so that observed patterns were a function of the differences across location, as opposed to differences of measurement or construction of localised data sets. One-thousand metres network-distance buffers were mapped around schools using ArcMap V.10.7, referred to henceforth as ‘school catchment areas’. This approximates walking distance for elementary school students; distances used in studies of active school transportation (AST) ranging from 400 m to 1.6 km.17 PCMVC as well as built and social environment correlates were then calculated for each buffer around schools.
AST was measured for a subset of schools (n=389) and added to the variables.9 AST measures were standardised by observer training, and all data were collected in the spring, and not collected on days with special programming (eg, walk or cycle to school days) or inclement weather.12 The proportion of children arriving by active modes was estimated from the total number of children observed per school. Children observed arriving by school bus were not included in the denominator. If it was unclear whether the child arrived using public transit, they were counted as walking, as they were observed to be pedestrians for a portion of their journey.
Primary outcome variable
Collision data were derived from police reports. Child PCMVC (age 1–12 years), between 2012 and 2017 in Calgary, 2014–2018 in Peel Region, and 2012–2018 in Toronto, Montreal and Laval, were included. Collisions were assigned to schools using the two-step floating catchment area (2SFCA) method18; collisions were assigned proportionally based on distance to schools where two school areas overlapped (see online supplemental material 1 for details).
Supplemental material
Correlates
Potential correlates of PCMVC3 19 were mapped and grouped into (1) land use and social environment (2) roadway environments and (3) traffic safety interventions. These groupings were based on published reviews.19–21 From a planning perspective, these groupings are environments that can be modified in the long term (ie, land use and social environment), the medium term (ie, roadway environments) and short term (ie, traffic safety interventions).20 21 These variable groups were each modelled separately as well as together in a full model to assess their individual and collective influence on PCMVC.
Covariates
Child population data (age 1–12 years) from the 2016 Canadian Census and the length of road were included as covariates to control for areas with more collisions because of more children living in the area or more dense road networks, respectively.
Data sources/measurement
The CHASE research group has developed a large spatial built environment database for several Canadian cities.9 Traffic safety interventions may be reported differently by city; however, these features were standardised across cities in the database and mapped onto the national road network. Some cities did not have certain features or did not compile data on certain traffic calming features, which prevented exploration of their influence. In addition, features such as ‘major roads’ may describe different traffic environments in different cities. For these reasons, we conducted city-specific analyses in addition to an overall analysis.
Statistical methods
Descriptive summaries were provided for the 1000 m school area as the unit of analysis. Multivariable negative binomial regression models (selected due to data overdispersion) estimated the associations between each group of independent variables and the outcome variable—PCMVC injury. The primary model included all cities, with ‘city’, included as a random effect. We also ran city-specific models to explore consistency of associations across municipalities.
Full models considering all independent variables were estimated for all cities together using manual forward stepwise regression, with p<0.2 as a threshold for inclusion and balancing model fit using Akaike’s information criteria and log likelihood.22 The full model was then applied to each municipality. Variance inflation factors (VIFs) calculated to identify multicollinearity and variables with VIFs>5 were removed.23 These models were then applied to each city to compare effects across cities. All models were run in the subset of schools with AST data (n=389) to determine its effect on the other built and social environment covariates. As AST did not importantly impact associations between other variables and CPMVC, we decided to present associations with collision in the larger group of schools.
Results
Outcome variables
Mean collision rates per school across cities varied substantially from a low of 0.13 collisions/year in Peel Region to a high of 0.35 collisions/year in Montreal (table 1). The proportion of collisions involving child cyclists was 25.4% overall, ranging from 8.9% in Peel to 44.6% in Laval. Variability was significant within cities, for example, in Toronto, the 25th percentile school had 0.11 collisions/year while the 75th percentile school experienced 0.38 collisions/year (see figure 1). We also present collision rates per 1000 children walking and biking to school, finding a median pedestrian collision rate ranging from 0.15 per 1000 children walking to school in Peel to 0.56 in Calgary. Median cyclist collision rates per 1000 children cycling to school ranged from 0 (Calgary, Toronto, Peel) to 3.48 in Montreal, with very high tail end rates for cyclists at the 75th percentile schools in all cities except Peel (table 1 and online supplemental figures 1B and 1C, appendix).
Social and built environment correlates/covariates and collisions, descriptive statistics by city and school catchment areas (mean, SD)*

Collisions per school per year by city, median with interquartile ranges. CAL, Calgary; LAV, Laval; MTL, Montreal; PEL, Peel; TOR, Toronto.
Independent variables
There were large variations in the number of children and total road kilometres within school catchment areas across cities (see table 1). The five cities also showed substantial variation in the social and built environment. Toronto and Montreal, older and larger cities, had far higher multidwelling density and old homes compared with newer cities. The highest proportion of local roads was seen in Calgary, at over 92% compared with a low of 67% in Toronto. Traffic safety interventions varied, with Peel having no traffic calming interventions or speed humps, Calgary having no adult crossing guards, and Laval not having data on crosswalks, limiting the ability to include these in a model with all cities together. In all school areas, speed humps and other traffic calming features were very rare (eg, highest was 6.1% in Montreal).
Models
Covariates
Child population was significantly associated with collision rates with an incidence rate ratio (IRR)=1.53 (95% CI 1.37 to 1.72, per increase of 1000 children)—this positive association was consistent across cities, though not always statistically significant. Kilometres of roads was positively associated with more collisions (IRR: 1.03, 95% CI 1.02 to 1.04, per km). See online supplemental files, Table A, for descriptions of all covariates and data sources.
Land use and social environments
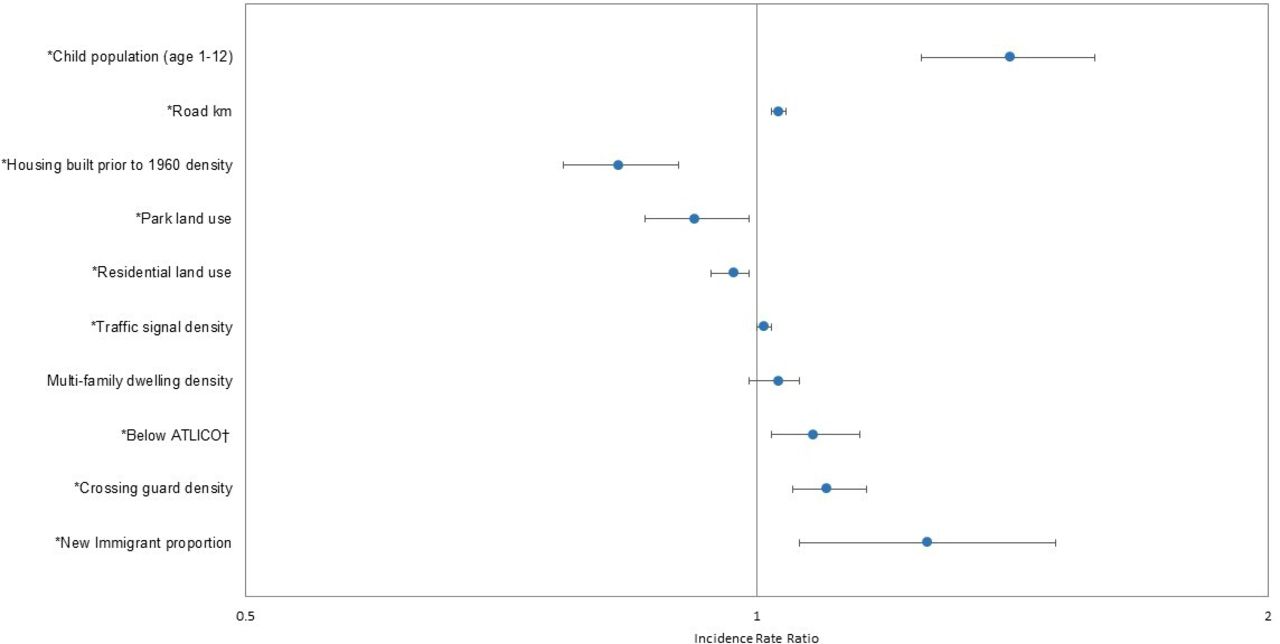
Land use and social environment variables were modelled overall (figure 2) and by city (online supplemental figure 2B). In the model including all cities, features significantly associated with a decrease in collisions included the proportion of older homes (IRR: 0.87, 95% CI 0.81 to 0.94, per 1000 homes per km2) and the proportion of residential land use (IRR: 0.96, 95% CI 0.93 to 0.99, per 10% increase in proportion). A small increase in rate of collisions was associated with higher multidwelling density (per 1000 homes/km2). Increased collisions were also associated with social environment features, including proportion of households below after-tax low-income cut-off (IRR: 1.10, 95% CI 1.03 to 1.17, per 10% increase in population proportion) and recent immigrant proportion (IRR: 1.26, 95% CI 1.06 to 1.50, per 10% increase in population proportion).

Adjusted negative binomial model including all cities—land use and social environment features associated with collision incidence rate ratio with 95% CIs (*indicates significant correlates/covariates, † ATLICO refers to After tax low Income cut-off.)
In city-specific models, higher residential land use was consistently associated with lower collision rates, while higher multidwelling density was consistently associated with higher collision rates (except in Laval). Older home density was inconsistent and was associated with lower collision rates in Montreal and Toronto and higher collision rates in the other cities.
Roadway environments
In the model including all cities (see figure 3), local road density was significantly related to lower collision rates (IRR: 0.93, 95% CI 0.88 to 0.98, per 10% increase in local road proportion) while intersection and traffic signal density did not show significant associations. Road features had consistent effects across each of the regions (see online supplemental figure 3B). All regions, except Laval, had lower collision rates with higher local road density and higher collision rates with higher intersection density.
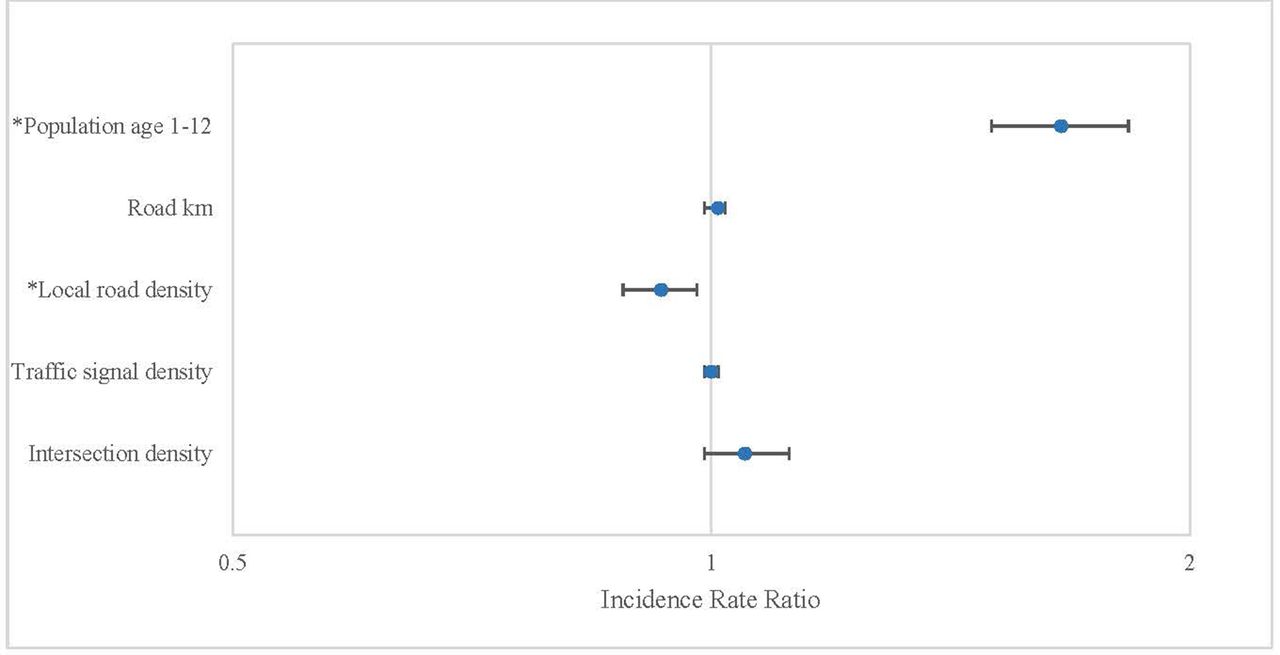
Adjusted negative binomial model including all cities—road environment features associated with collision incidence rate ratio with 95% CIs (*indicates significant correlates/covariates).
Traffic safety interventions
In the model including all cities (See figure 4), only speed humps were associated with lower collision rates (IRR: 0.86, 95% CI 0.80 to 0.94, per increase in speed hump segments per 10 km of road). Adult crossing guard density was associated with higher collision rates (IRR: 1.08, 95% CI 1.02 to 1.14, per 10% increase per road km). In city-specific models, speed humps, where present, were associated with lower collision rates, while other traffic calming had little impact, aside from a trend towards lower rates in Toronto (see online supplemental figure 4A).

Adjusted negative binomial model including all cities—traffic safety interventions associated with collision incidence rate ratio with 95% confidence intervals (*indicates significant correlates/covariates).
Fully adjusted models
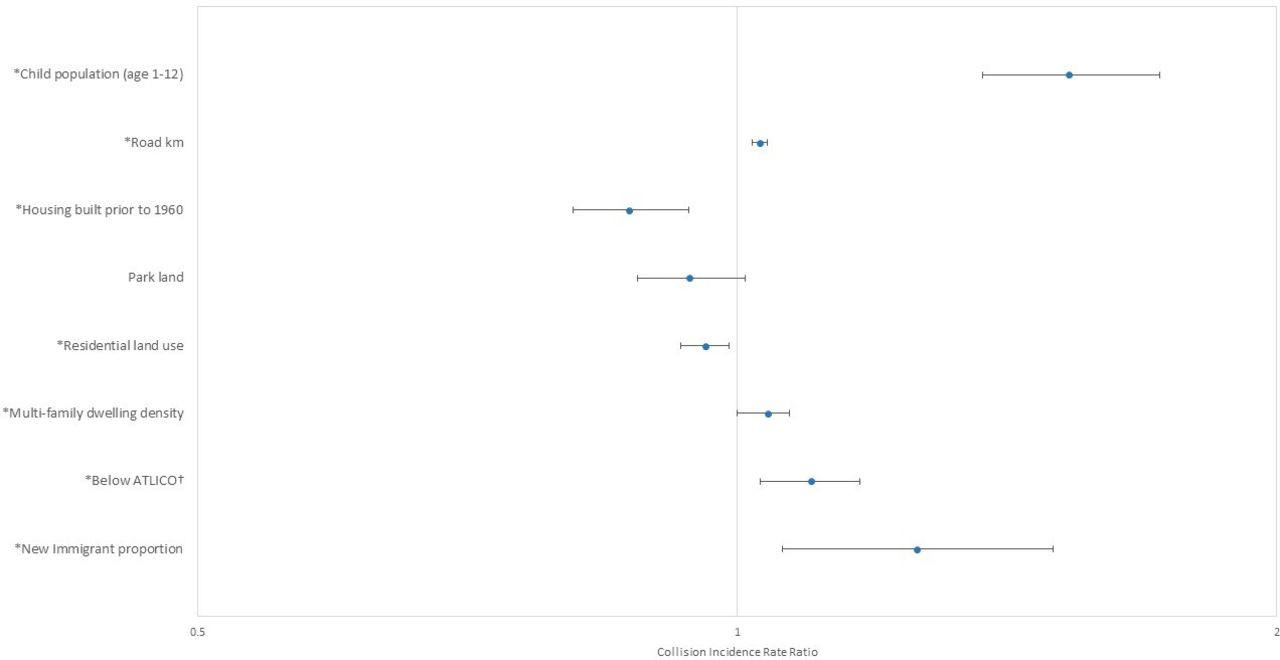
A fully adjusted model was created considering all groupings of independent variables together (see figure 5). The features that remained significant in the full model were mainly land use and social environment features. Aside from child population, new immigrant population had the largest association with higher PCMVC (IRR: 1.26, 95% CI 1.06 to 1.50) while housing built prior to 1960 was most associated with lower PCMVC (IRR: 0.83, 95% CI 0.77 to 0.90).
Adjusted negative binomial model including all cities—fully adjusted model with collision incidence rate ratio with 95% confidence intervals (*indicates significant correlates/covariates, †ATLICO refers to After tax low Income cut-off).
The fully adjusted model was then applied to each city (see online supplemental table B). In these models, residential land use was consistently associated with fewer collisions, while social indicators and adult crossing guard density were usually associated with more collisions. Trends differed between regions (eg, housing built prior to 1960 was associated with fewer collisions in Montreal and Toronto, but more collisions in other regions).
Adjusting for active school transportation
The subset of 389 schools were modelled for each grouping of independent variables, with and without AST proportions (see online supplemental tables C, D, E, F, G, H). Higher AST was always associated with an increase in collisions and was significantly associated with collisions in models including all cities. However, including AST did not lead to a greater than 10% change24 in effect size for the majority of other correlates/covariates. The exceptions were for the correlates of child population in Calgary and Peel models and park land use, housing built before 1960, and crosswalks in Peel.
Discussion
Child PCMVC collisions in Canadian cities were related to built environment characteristics at three levels: land use and social environment, roadway environments and traffic safety interventions. This suggests that optimising the built environment may be effective in reducing child vulnerable road user deaths and injuries. This multicentre study compared environments across and within a variety of urban and suburban contexts, facilitating generalisability to other North American cities.
Child PCMVC around schools was highly variable both across and within cities. This variability most likely reflects diversity in land use and social environment, roadway environments and traffic safety interventions. For example, higher densities of some land use features (eg, multifamily dwellings) are more common in Montreal and Toronto compared with Peel, Calgary and Laval, which are more suburban.12 These built/social environments can influence PCMVC through their impact on children’s exposure to the road, either through impacting child active transportation and play on the streets, or related to the number, volume and speed of cars.7 25 When using the number of children using AST as the denominator, we observed higher collision rates per child journey in some cities with lower walking rates. This may reflect less walking in cities that are less well designed for safe walking, or it may suggest a safety in numbers effect.26 27 The concept of ‘safety in numbers’—that risk per walker decreases as the number of walkers increases—has support in the literature for adult pedestrians and may also be true for child pedestrians.26 27 Bicycle collision rates per 1000 children cycling may not be directly comparable to pedestrian injury rates because cycling collisions may occur during recreational cycling rather than school travel in the 4–11-year age group, and we were not able to measure rates of recreational cycling.
Across the cities, land use and social environment dominated the effects of road network design or traffic safety features. Density of older homes and residential land use was associated with lower PCMVC. Density of older homes was correlated with higher child population, road network density and multidwelling homes, representing dense urban cores, particularly in Toronto and Montreal.
Road network design, and, in particular, traffic safety features, may not have been prominent in the model across all cities, because of limited deployment of traffic safety features such as speed humps in Canadian cities. High-quality pre–post analyses indicate that slowing traffic and measures to separate active travellers from motor vehicle traffic can reduce injuries among vulnerable road users.28 Speed humps were associated with fewer collisions in this study (despite minimal implementation). Some cities had no speed humps, despite their established effectiveness, including a 43% reduction in a pre–post examination of child pedestrian collisions in Toronto.29–31
Crossing guards, where present, were associated with higher collision rates. This has been found in previous studies in Toronto and Montreal.32 33 In cross-sectional studies such as this one, the association may not be causal for many reasons, including deployment of adult crossing guards in response to a prior collision or deployment of adult crossing guards indicates an effort to mitigate a dangerous traffic area. Of note, guards do not work throughout the entire day and so may not be around to offset the risk factors associated with higher collision rates at those specific, more dangerous locations.34 A quasi-experimental pre–post implementation study done in Toronto, Ontario found no changes in collision rates after the implementation of crossing guards, which may be a positive finding in light of previous research showing that adult crossing guards are associated with more AST.8 34
The higher collision rates observed in areas with lower income populations and higher new immigrant population suggest that social equity considerations are important in reducing child road traffic injury. In Toronto, road safety features have been deployed inequitably, with speed hump density found to be four times lower in low versus high-income clusters.35 Making changes to the physical environment to reduce this social inequity is likely the most effective public health approach to PCMVC reduction. For example, speed humps or other locally appropriate interventions can be targeted to areas experiencing social deprivation and higher collisions.
The relationship between built and social environmental determinants and PCMVC did not change with different levels of AST. This suggests that built and social environment features are independent in their influence on injury rates and not simply mediated through their effect on child pedestrian or cyclist volume. If so, injury prevention interventions may remove barriers to parents and children choosing active modes of school transportation conferring additional ‘safety in numbers’ benefits in addition to positive health, social and environmental outcomes.36–39
The proportion of cycling collisions was high, a full quarter of the PCMVC, despite that only a small proportion of children cycle to school (4.1% in our dataset).12 This indicates that the risk of cycling may be even higher than walking for children, aligned with findings for adults in the USA.40 This finding suggests a particular need for separate bicycle infrastructure from motor vehicle infrastructure, including in neighbourhoods to facilitate children’s safe travel. Separated cycling infrastructure, such as cycle tracks, has been seen as effective for reducing collisions in pre–post studies.41 To date, separated facilities, where implemented in Canadian cities, tend to be in downtown areas, and not in areas with higher proportions of children.42
Strengths and limitations
Strengths of this study include the large sample, diverse settings, cleaned and consistent built environment data and methodological contributions including the 2SFCA technique to assign collisions to schools (see online supplemental material).18 The cross-sectional and ecological nature of this study precludes causal interpretation.
Limitations include the considerable heterogeneity between cities across all the correlates. Some important interventions (eg, speed humps) were deployed very rarely around schools, and not at all in some cities, making it difficult to estimating safety effects of such interventions within this type of study design. In addition, traffic volume and speeds could not be accounted for in this study, as there are no regularly collected counts on local streets where schools are generally located in Toronto.
Another limitation was that although AST was measured at a subset of schools, it was not an appropriate denominator to calculate collision risk per child. This was due to the fact that it was not possible to link the collisions specific to a school and school travel. The collisions were known to have occurred within the school catchment areas; however, the child victim could have attended another school out of the area. The focus on the child as the unit of analysis could also have provided a potential for human behaviour/victim blaming inference that detracts from these data, which suggest an opportunity to make built environments safer for children.
Finally, these analyses are subjected to the modifiable areal unit problem whereby findings are sensitive to the geographical boundaries used.43 We used 1000 m buffers around schools as the geographical unit of analysis. However, not all collisions in this analysis were related to travel to school. This was a useful approach for this analysis, as collisions tend to decrease with increasing distance from school.10 Furthermore, these are also areas where children are travelling and, therefore, are important targets for traffic safety interventions.44 The use of school catchment areas as the unit of analysis is appropriate as predictor variables belong to school areas rather than to individual children. In addition, the intended interventions were built environment/social environment interventions, which are typically applied to geographical areas not individuals.
Interpretation
Adapting the built environment is a promising approach to preventing child pedestrian and cyclist injury. The built environment influences injury rates at three levels: land use/social environment, road network design and traffic safety interventions, each of which is modifiable by city planning. Land use and social environment tend to take longer to implement, compared with changes to the road network and traffic safety modifications. Traffic safety modifications (eg, speed humps) are incompletely or not at all deployed in Canadian cities. In all the cities, built environment modifications could potentially improve safety by applying Vision Zero principles. Short-term interventions were supported by the current results, including prioritising social equity in planning road safety interventions and deploying traffic calming.
Reducing injury risk to vulnerable child road users is as simple as separating children in time and space from speeding motor vehicles. Opportunities to do this exist at the level of land use and city design, at the level of design of the road network and at the level of individual traffic interventions. Because social environment was a strong determinant of collisions, new road safety interventions should be deployed and evaluated with an eye to equity, in order to ensure safe roads for all.
Key messages
What is already known on the subject
Teaching children safer behaviours does not make them safer in traffic.
For adults, built environment interventions can prevent pedestrian injuries.
What this study adds
Built environment is significantly associated with child pedestrian and cyclist injury rates in Canadian cities.
Built environment associations with collisions exist at three levels—land use, road system design, traffic safety interventions.
The association between built environment and injury remains the same when adjusting for differences in child pedestrian and cyclist activity.
Data availability statement
Data are available upon reasonable request.
Ethics statements
Patient consent for publication
Ethics approval
Research ethics boards at the University of Calgary, Institut national de la recherche scientifique, the Hospital for Sick Children, York University, the Toronto and Peel District School Boards and Simon Fraser University granted ethics approval for this study.
Acknowledgments
This study was conducted by members of the CHASE (Child Active Transportation Safety and the Environment) study. We would like to thank all the members of CHASE, including investigators, collaborators, partners, staff and trainees.
References
Supplementary materials
Supplementary Data
This web only file has been produced by the BMJ Publishing Group from an electronic file supplied by the author(s) and has not been edited for content.
Footnotes
Twitter @NaomiSc86342710, @MarieSoleil_C
Correction notice This article has been corrected since it was first published. The open access licence has been updated to CC BY.
Contributors LR: Conceptualization, Methodology, Data curation, Analysis, Writing – Original Draft, Review & Editing, Supervision, Funding acquisition. NS: Conceptualization, Methodology, Analysis, Writing –Original Draft, Review & Editing. MSC: Conceptualization, Methodology, Data Curation, Analysis, Writing - Review & Editing Funding Acquisition. MW: Conceptualization, Methodology, Analysis, Writing-Review & Editing, Funding Acquisition. CM: Conceptualization, Methodology, Writing - Review & Editing, Funding Acquisition. BEH: Conceptualization, Methodology, Writing - Review & Editing, Funding Acquisition AM: Conceptualization, Methodology, Writing - Review & Editing, Funding Acquisition NEA: Conceptualization, Methodology, Writing - Review & Editing, PF: Conceptualization, Writing - Review & Editing, Funding Acquisition AH: Conceptualization, Methodology, Analysis, Writing – Original Draft, Review & Editing, Supervision, Funding acquisition, Guarantor.
Funding This study was supported by the CIHR Team Grant: Environments and Health: Intersectoral Prevention Research, The Built Environment and Active Transportation Safety in Children and Youth number IP2-150706. The funders peer-reviewed the original application and have no role related to ongoing research activities.
Competing interests The authors declare that they have no known competing financial interests or personal relationships that could have appeared to influence the work reported in this paper.
Provenance and peer review Not commissioned; externally peer reviewed.
Supplemental material This content has been supplied by the author(s). It has not been vetted by BMJ Publishing Group Limited (BMJ) and may not have been peer-reviewed. Any opinions or recommendations discussed are solely those of the author(s) and are not endorsed by BMJ. BMJ disclaims all liability and responsibility arising from any reliance placed on the content. Where the content includes any translated material, BMJ does not warrant the accuracy and reliability of the translations (including but not limited to local regulations, clinical guidelines, terminology, drug names and drug dosages), and is not responsible for any error and/or omissions arising from translation and adaptation or otherwise.