Article Text

Abstract
Background The objectives of this research were to determine the savings of loss-of-life expectancy (LE) and lifetime medical costs (LMC) from prevention of spinal cord injuries (SCI) in Taiwan.
Methods From the claims database of Taiwan National Health Insurance, we identified 6164 adult patients with newly diagnosed SCI with permanent functional disability from 2000 to 2015 and followed them until the end of 2016. We estimated survival function through the Kaplan-Meier method and extrapolated it to lifetime.
Results For the SCI cohort, the LE and loss-of-LE were 17.6 and 13.3 years, respectively, while those for SCI with coding of external causes (E-code) were 18.1 and 13.0 years, respectively. For the SCI cohort with E-code, the loss-of-LE of motor vehicle (MV)-related SCI was significantly higher than that of fall-related SCI. In young and middle-aged patients with SCI with E-code, the loss-of-LE of MV-related paraplegia was significantly higher than that of MV-related quadriplegia and fall-related SCI. With a 3% discount rate, the LMC for patients with SCI after diagnosis were US$82 772, while those for patients with SCI with E-code were US$81 473. The LMC and the cost per year for those living with quadriplegia were significantly higher than those for paraplegia in all age groups, possibly related to the higher frequencies of stroke, chronic lung disease and dementia.
Conclusions We conclude that quadriplegia has a higher impact on medical costs than paraplegia, and MV-related SCI has a higher impact on loss-of-LE than fall-related SCI. We recommend comprehensive SCI prevention be established, including infrastructures of construction and transportation.
- spinal cord injury
- cohort study
- economic analysis
- longitudinal
- burden of disease
- costs
Data availability statement
Data are accessible through the Institutional Review Board (IRB) of the National Cheng Kung University Hospital (NCKUH) for researchers who meet the criteria to access confidential data for academic purposes with a permission letter. The IRB of NCKUH is entitled and has full rights to oversee all activities of each researcher, to comply with the Personal Data Protection Act. Anyone who is interested in analysing the same data set must write a research proposal with full protection of human rights and apply to the IRB of NCKUH to get access. Accompanied with the approval letter from the ethics committee of the researcher’s institution and the research proposal, the researcher can email the application to the Collaboration Center of Health Information Application, Ministry of Health and Welfare to access the data.
Statistics from Altmetric.com
Introduction
Injuries and their associated disabilities impose substantial economic and disease burden. Spinal cord injury (SCI) is one of the most serious injuries that occur all over the world.1 It was supposed for many decades that once SCI had occurred, the damage of the central nervous system was persistent and recovery was impossible. Although neurorestorative interventions have been shown to be beneficial, there is no effective treatment to restore SCI.2 The proportion returning to work differs substantially by injury group and is the lowest in spinal cord-injured patients compared with other injury groups, like chest and abdominal injuries.3 The costs of SCI for both individuals and societies are high.4–6 In clinical settings, several combinations of measures have been used to provide different views on the healthcare burden of injuries.7 Reasonable estimations of the life expectancy (LE), loss-of-LE and lifetime medical costs (LMC) are of tremendous value for decision-making in medical research, healthcare financing and healthcare policies.
Krueger et al 6 collected statistical data on healthcare costs in patients with SCI and found that healthcare costs were the greatest for patients with quadriplegia during initial care and for subacute care and long-term care. However, due to unavailable data, several estimates for different categories of healthcare costs were not measured (eg, paramedical services, diagnostic evaluation and outpatient medications). In Taiwan, the mean cost per hospitalisation of patients with SCI is around US$8000, which is significantly higher than hospitalisations due to other major injuries.5 For several decades, the mortality rates after SCI have remained elevated, and the LE was most significantly reduced in persons with higher level injuries and more severe impairments.8 The mean medical cost after SCI increased with age, and in every age group there was considerable variance.9 However, costs resulting from conditions that were not directly related to SCI were not measured, possibly due to unavailable data. Comprehensive estimates of LMC and the cost per year (CPY) for those living with SCI in different age groups, types and aetiologies of SCI can serve as a basis for allocation of healthcare resources, which is why relevant research in this area is of importance to patients with SCI.
The aim of this study was to provide comprehensive estimations of the savings of loss-of-LE and LMC from prevention of SCI in Taiwan.
Materials and methods
Study design and patient identification
We used ICD-9 (International Classification of Diseases, Ninth Edition) diagnosis codes 806 (SCI with fracture of vertebral column) and 952 (SCI without evidence of spinal bone injury) to represent SCI10 in the nationwide health insurance claims database and interlinked them with two other data sets, the Taiwan Mortality Registry (2000–2015) and the Taiwan National Vital Statistics (2000–2015), as summarised in figure 1. All patients ≥16 years of age with newly diagnosed SCI were included. The index date was the date of the first hospitalisation due to SCI within the period from 1 January 2000 to 31 December 2015. There were four groups of anatomical sites for SCI, including cervical (806.0-1, 952.0), thoracic (806.2-3, 952.1), lumbar (806.4-5, 952.2) and sacral (including cauda equina) levels, excluding uncertain levels (806.8-9 and 952.8-9).11 Due to the sparse number of cases, the latter three (ie, thoracic, lumbar and sacral levels) were combined for analysis and designated as paraplegia.12–14 The Registry for Catastrophic Illness by the National Health Insurance (NHI) of Taiwan was used as a proxy for identifying patients with SCI with permanent functional disability (n=6164). A code of external cause (ICD-9 External Cause of Injury Code, E-code) was provided for about 64.5% of patients with SCI, which was used to identify patients with SCI with E-code (n=3975) (online supplemental figure 1). Thus, they were further stratified into subgroups according to motor vehicle (MV; E-codes: E810–E848), fall-related (E-codes: E880–E888) and others at the first hospitalisation due to SCI. The prevalence of major comorbidities 1 year before and after SCI was also measured, including stroke, acute myocardial infarction, chronic obstructive pulmonary disease (COPD), liver cirrhosis, end-stage renal disease (ESRD), cancer, dementia, Charlson Comorbidity Index15 and concurrent traumatic brain injury (TBI).
Supplemental material
Flow diagram of patients with spinal cord injury (SCI) and their relevant information for estimation of lifetime survival function, life expectancy (LE) and lifetime medical costs.
To assure the validity of diagnosis, we only included patients with SCI recorded in the Registry for Catastrophic Illness. Since the patients in this registry are waived from all copayments, each of them must be certified by a specialist and validated by another specialist to prevent abuse. Moreover, as patients with SCI with temporary functional disability do not qualify for an exemption of such copayment, our inclusion criteria would generally assure the validity of diagnosis. The only chance of misclassification for an elderly disabled patient with SCI would be those which occurred before 1996 when the system was first established. In this study, we only included new SCI cases after 2000 to guarantee diagnostic accuracy.
Survival function estimation and extrapolation
For the observed survival data of the study population, the Kaplan-Meier method16 was adopted to assess survival function  along a follow-up period of F months, from the time of onset t0 to the end of the follow-up period tF
. The Monte Carlo method was used to create a reference population from the life table of the calendar year matched with every patient of the same age and gender. This life table was obtained through information released by the Department of Statistics, Ministry of the Interior. With the survival data from the simulated reference population, we were able to obtain the survival function
along a follow-up period of F months, from the time of onset t0 to the end of the follow-up period tF
. The Monte Carlo method was used to create a reference population from the life table of the calendar year matched with every patient of the same age and gender. This life table was obtained through information released by the Department of Statistics, Ministry of the Interior. With the survival data from the simulated reference population, we were able to obtain the survival function  ,
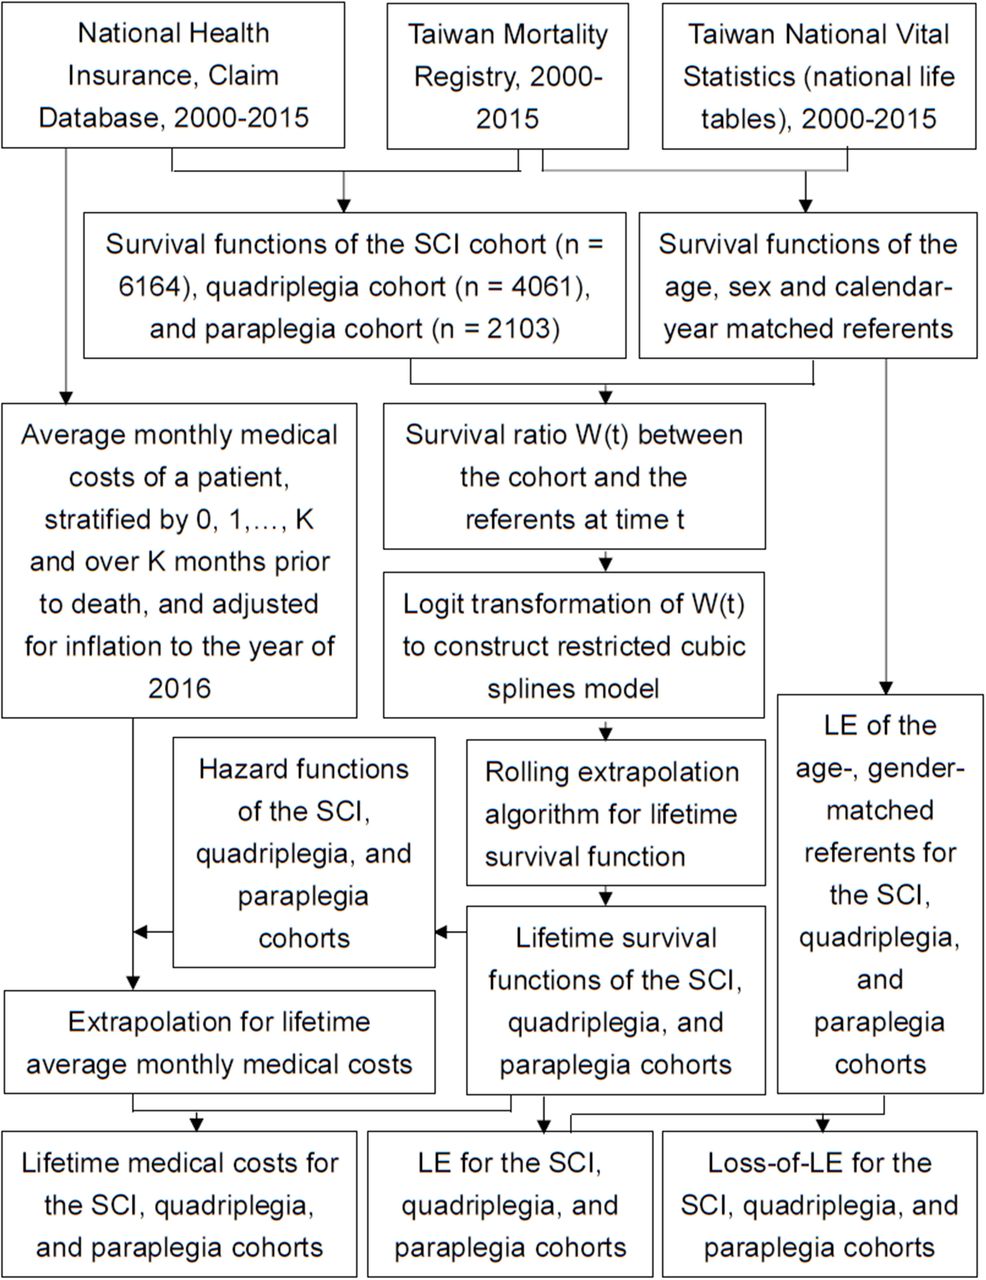
, for the reference group. The relative survival function W(t) was defined as the ratio of the survival function in the study population to that in the reference population at time t. Because patients with SCI are likely to suffer from premature mortality, W(t) would be a real number ranging between 0 and 1, and logit W(t) curve would become linear after an initial stage of about 1–2 years of treatment.17 Hwang and Wang18 have suggested the following formula for the short time period
  approaching the end of the follow-up period tF
:
approaching the end of the follow-up period tF
:
 3
3
The logit W(t) for extrapolation beyond the follow-up period can be estimated with the  ,
, , where
  and
and  are the intercept and slope of the linear model obtained with formula (3), respectively. Therefore, the extrapolation formula for the survival function is as follows:
 4
4
The restricted cubic spline model combined with a rolling-over algorithm for extrapolation was used to fit the smooth curve of the logit W(t) to the entire follow-up period.16 Formula (4) can thus be replaced by the following equation:
 5
5
The area between the complete survival curves of the reference population and the index cohort is an estimate of the loss-of-LE. A 95% CI of the loss-of-LE estimate can be obtained using bootstrap methods. We also validated this novel method by using the first 10 years of data to predict the survival rate at the end of the 16th year.
Estimation of medical costs
The Taiwan NHI is a reimbursement system under fee-for-service. Patients with SCI and permanent functional disability can be registered as having catastrophic illness and waived from all copayments. While providing healthcare to a patient with SCI, the responsible physician must differentiate whether the care services could be attributed to the catastrophic illness and waived from copayment. All costs reimbursed after SCI were counted in the lifetime costs, but only those under the catastrophic illness category were counted as SCI-related. For the purposes of comparison, all costs were transformed into 2016 new Taiwan dollars (NT$), according to the consumer price indices for the healthcare service basket in Taiwan from 2001 to 2016.19 The exchange rate in 2016 was US$1 to NT$32.3. The cost estimation was based on a 3% discount rate.20 In accordance with the model designed by Basu and Manning,21 the mean accumulated costs over a specific period of time can be represented by the sum of the weighted average of the mean costs in expired cases during that period of time and the expected costs of non-deceased cases during the same period. Hwang et al 16 have extended the concept into the following formula after obtaining the lifetime survival function through the aforementioned extrapolation algorithm:
 (6)
(6)
where  ,k=0, 1, …, K represents the estimated mean costs in the jth month for subjects who died in the (j+k)th month. The corresponding weights
  represent the proportion of subjects who were still alive in the jth month and survived until the (j+k)th month.
  is the mean cost in the jth month for subjects who did not die in the next K months. The above estimations were performed using ISQoL2 software, which is based on R language.
Statistical analysis
Differences between various types of SCI were assessed using an independent t-test for continuous variables and the χ2 test for nominal variables. A p value of <0.05 was considered to indicate statistical significance. We examined differences in per-person LE and LMC between the groups using a two-sided z-test (two-sided alpha error <0.05). Standardised mortality ratios (SMRs) were calculated as the observed to expected ratio based on the age-specific, sex-specific and calendar year-specific mortality rates in the Taiwanese population. All statistical analyses were performed with the SAS V.9.3 statistical package.
Results
Sociodemographic characteristics of the study population
As summarised in table 1, we recruited a total of 6164 newly diagnosed adult patients with SCI. About two-thirds of the cases were quadriplegia, while one-third were paraplegia, with the average age of the former being 6 years older than the latter, or 51.6 vs 45.4 years old. Men accounted for 82.4% of patients with quadriplegia and 70.6% of patients with paraplegia. The majority of external causes in SCI were MV and fall. We classified patients with quadriplegia with E-code into MV-related (n=1350) and fall-related (n=735) injuries, while the proportion of paraplegia with E-code was almost 1 to 1 for MV-related and fall-related injuries according to external cause codes. The mean age of MV-related paraplegia was the youngest among the SCI cases resulting from external causes. The number of concurrent TBI was higher in quadriplegia than that in paraplegia. Comparing the prevalence of major comorbidities before and after SCI onset, patients with quadriplegia seemed to have higher frequencies of stroke, COPD and dementia than paraplegia (table 1).
Comparison of demographic and clinical characteristics between patients with quadriplegia and paraplegia
Estimations of SMR, LE, loss-of-LE and LMC in SCI
The 17-year follow-up data were used to extrapolate the lifetime survival time up to the 50th year after diagnosis for the estimation of the LE, which was 17.6 years after diagnosis of SCI, as depicted in figure 2. The validation study showed that the relative biases of extrapolation from the end of the 10th year to the 16th year for each stratified subcohort were all less than 10% (two-thirds of the subgroups less than 3.5%), as summarised in online supplemental table 1. Compared with the sex-matched and age-matched referents, the LE and loss-of-LE were 17.6 and 13.3 years, respectively, for patients with SCI. Namely, the slope of logit transformation of the survival ratio is estimable for patients with SCI.

Estimation of lifetime survival function in patients with spinal cord injury (SCI). (A) The red dashed line curve indicates the survival curve of SCI estimated by Kaplan-Meier method, which was extrapolated to lifetime depicted as blue dotted line. The loss-of-life expectancy is the area difference between the survival curves of SCI and age, sex, calendar year matched referents simulated from vital statistics (black line). (B) A typical logit-transformed curve of the survival ratio between the index cohort and the matched referents from beginning to the end of follow-up (black line). The restricted cubic spline model (red dashed line) fits very well with the real logit-transformed curve throughout the entire follow-up period. Then, it was combined with a month-by-month rolling-over algorithm to extrapolate to lifetime for the index cohort,16 as illustrated by the blue dotted line in (A).
There seems to be no significant difference in the estimates of LE and loss-of-LE between male and female patients with SCI. Among the traumatic SCI cases, however, the loss-of-LE of MV-related SCI was higher than that of fall-related SCI, or 17.5 years (95% CI 15.0 to 19.0) vs 11.7 years (95% CI 7.8 to 14.6 years) (table 2). Among young and middle-aged adult patients with SCI (namely, 16–59 years old), the loss-of-LE of MV-related paraplegia was significantly higher than that of MV-related quadriplegia (27.3 vs 18.5 years old), as summarised in table 3. The LE and loss-of-LE estimates for the different types of SCI stratified by age groups are summarised in online supplemental table 2.
Health impact of SCI measured by LE, loss-of-LE, LMC (US$ with 3% discount) and SCI-related LMC stratified by sex, age and traumatic causes (MV injuries and falls)
Comparison of SMR, LE, loss-of-LE, LMC (US$ with 3% discount) and SCI-related LMC for young and middle-aged (namely, 16–59 years old) patients with quadriplegia and paraplegia stratified by MV injuries and falls
The LMC and SCI-related LMC stratified by sex, age and traumatic causes are shown in table 2. The CPY for those living with SCI stratified by age and level of injury is shown in online supplemental table 2. After applying a 3% annual discount rate, we found that there was no significant difference between different genders of patients with SCI for the estimated LMC and CPY values. The SCI-related LMCs were around 60%–70% of LMCs (tables 2 and 3 and online supplemental table 3).
Discussion
Strengths of this study
This is the first population-based cohort study from Asia to assess the LE, loss-of-LE, LMC, SCI-related LMC and CPY for patients with SCI with permanent functional disability stratified by level of injury, age and aetiologies. The major strengths of this study include at least the following features: First, this is a nationwide collection of subjects with SCI with a large sample size, 17 years of follow-up, and comprehensive data on the level of injury, age and medical costs, and 64.5% were coded with external causes. As patients with SCI included in the Registry for Catastrophic Illness are eligible to waive all copayments, the accuracy of diagnosis has been assured by two specialists and NHI audits. Second, since our validation study of using the first 10 years of data to extrapolate to the end of the 16th year shows a less than 10% relative bias (two-thirds of the subgroups less than 3.5% in online supplemental table 1), it would be reasonable to speculate that our extrapolation after follow-up would be accurate. Third, charges pertaining to all medical conditions in the NHI claims data related to SCI were comprehensive and available, including conventional Western medicine and Chinese medicine outpatient visits, dental visits, hospitalisations, medications prescribed, medications refilled, laboratory and imaging examinations, and procedure codes.22 Thus, our estimates of lifetime direct medical costs would be more comprehensive and accurate than previous studies on the health impact and financial burden of SCI with permanent functional disability and would be useful for public health policy and prevention decision-making.
Higher financial impact of quadriplegia than paraplegia
In this study, we also found that the LMCs and CPYs of quadriplegia were significantly higher than those of paraplegia in all age groups, concurring with previous studies.6 23 24 In fact, patients with quadriplegia seemed to have higher frequencies of stroke, COPD and dementia than paraplegia (table 1), which would increase medical costs.
In general, MV-related injuries were the primary aetiology of SCI in developed countries (40%–60%), including the US, Japan and the UK.25–27 We found that the major aetiologies of SCI with E-code were MV-related and fall injuries in Taiwan, and the former had higher occurrence than the latter (table 1). Moreover, MV-related paraplegia resulted in higher loss-of-LE than MV-related quadriplegia and fall-related quadriplegia (table 3). This may have been caused by the young age (16–39 years old) of patients with MV-related paraplegia in our study. Further analysis of young-aged patients (16–39 years old) found that motorcycle injury accounted for 51.0% of paraplegia SCI in contrast to 42.1% of quadriplegia SCI (p=0.04), while there was no significant difference in other age groups (data not shown in table 1). Our results seem similar to findings in Australia, in which there was a higher proportion of paraplegia among motorcycle-related SCI.28 Future studies are warranted to explore into the detailed mechanisms of injury and develop relevant prevention strategies.
Limitations of this study
Several limitations of this study must be acknowledged. First, the use of claims data for SCI studies would raise question on the validity of diagnosis. However, we only included hospitalised SCI cases registered in the Catastrophic Illnesses Registry. Since all patients with SCI successfully registered in the Catastrophic Illnesses Registry can be waived from all copayments, their permanent functional disability had to be validated by two specialists to prevent abuse. Thus, the diagnosis in this study is relatively accurate. Second, because E-code is not always required for reimbursement in the current system of Taiwan NHI and E-codes were only provided for 64.5% of our included cohort, we may have underestimated the proportion of traumatic injury, as was similarly reported in Australia.29 We thus recommend that the NHI administration take necessary actions to improve the completeness of coding for external causes. Third, since our NHI claims data do not contain clinical details of the MAIS, we are unable to make any inference on the burden of SCI with different severities. However, our Registry for Catastrophic Illness stipulates that these patients must present with moderate to severe permanent functional disability to be eligible, and our estimations cannot be generalised to patients with SCI with mild functional impairment, such as those with non-severing trauma. Fourth, since patients with SCI might develop other major diseases suitable for Registry for Catastrophic Illness as they grow old, there might be some patients registered with two diseases, especially those with cancer and/or ESRD (about 5%–6% increase after SCI in table 1), and we could have slightly overestimated the costs associated with SCI. As we only included costs that are accompanied with SCI in the three major diagnoses from clinic visits or five major diagnoses in the discharge record, the magnitude of potential overestimation would be small. In tables 2 and 3, MV injury-related medical cost made up about 60%–70% of the total medical cost, which appears similar to reports of patients with MAIS 4–5.30 Fifth, although the NHI covers assistive devices related to medical services (eg, thermoplastic splints), patients with SCI must turn to local social services to apply for home modification, wheelchair-friendly vans and so on. Namely, this study only covers medical costs and underestimates the overall costs. Future studies are warranted to estimate the societal costs of social services, productivity loss and so on.20
In conclusion, this study offers a comprehensive evaluation of the savings of loss-of-LE and LMC from prevention of SCI in Taiwan. We conclude that quadriplegia has a higher impact on medical costs than paraplegia, and MV-related SCI has a higher impact on loss-of-LE than fall-related SCI.
What is already known on the subject
Personal and social influences of spinal cord injury are substantial.
What this study adds
Quadriplegia has a higher impact on lifetime medical costs and cost-per-life year than paraplegia.
Higher prevalence of stroke, lung disease and dementia may account for higher costs in quadriplegia.
Motor vehicle-related paraplegia has higher life expectancy loss than quadriplegia in young people.
Data availability statement
Data are accessible through the Institutional Review Board (IRB) of the National Cheng Kung University Hospital (NCKUH) for researchers who meet the criteria to access confidential data for academic purposes with a permission letter. The IRB of NCKUH is entitled and has full rights to oversee all activities of each researcher, to comply with the Personal Data Protection Act. Anyone who is interested in analysing the same data set must write a research proposal with full protection of human rights and apply to the IRB of NCKUH to get access. Accompanied with the approval letter from the ethics committee of the researcher’s institution and the research proposal, the researcher can email the application to the Collaboration Center of Health Information Application, Ministry of Health and Welfare to access the data.
Ethics statements
Patient consent for publication
Ethics approval
This study was approved by the Institutional Review Board of the National Cheng Kung University Hospital, College of Medicine, National Cheng Kung University before commencement (approval no.: B-ER-105-386).
Acknowledgments
We are grateful to the Health Data Science Center, National Cheng Kung University Hospital for providing administrative and technical support. The data were obtained from the Health and Welfare Data Science Center (H106201). W-CL carried out his thesis research under the auspices of the Ph.D. Program in Tissue Engineering and Regenerative Medicine, National Chung Hsing University and National Health Research Institutes.
References
Supplementary materials
Supplementary Data
This web only file has been produced by the BMJ Publishing Group from an electronic file supplied by the author(s) and has not been edited for content.
Footnotes
Contributors W-CL, W-MW, FW and J-DW designed the study protocols. W-CL, W-MW, FW and J-DW collected the data. Data analysis and interpretation were performed by W-CL, W-MW, FW and J-DW. W-CL wrote the manuscript under the supervision of J-DW. W-CL, W-MW, FW and J-DW contributed significantly to revising the manuscript. All authors read and approved the final manuscript.
Funding We are grateful to the Ministry of Science and Technology, Taiwan, for funding this research under MOST 106-2314-B-006-017-MY3, MOST 108-2314-B-006-015, MOST 107-2627-M-006-007, and MOST 108-2627-M-006-001. We are grateful for grants from National Cheng Kung University Hospital (NCKUH-11004013).
Competing interests None declared.
Provenance and peer review Not commissioned; externally peer reviewed.
Supplemental material This content has been supplied by the author(s). It has not been vetted by BMJ Publishing Group Limited (BMJ) and may not have been peer-reviewed. Any opinions or recommendations discussed are solely those of the author(s) and are not endorsed by BMJ. BMJ disclaims all liability and responsibility arising from any reliance placed on the content. Where the content includes any translated material, BMJ does not warrant the accuracy and reliability of the translations (including but not limited to local regulations, clinical guidelines, terminology, drug names and drug dosages), and is not responsible for any error and/or omissions arising from translation and adaptation or otherwise.